Grenada
Carriacou
Petite Martinique
Grenada
Carriacou
Petite Martinique
Projections by year
Climate Risk Assessment
CARRIACOU
Access detailed precipitation and temperature data
by parish to understand climate impacts in Carriacou.
Access detailed precipitation and temperature data
by parish to understand climate impacts in Carriacou.
Climate modeling reveals trends of declining precipitation, increased drought frequency, and rising temperatures, especially under high-emission scenarios. Agricultural suitability modeling using Maxent shows that key crops—bananas, spices, cacao, and coconuts—will face shrinking viable growing areas, especially in lowland and coastal zones. Food crops and grasses (e.g., sugar cane) are similarly threatened, with future suitability largely confined to highland zones by 2070. The Climate Risk Atlas will serve as a critical tool for integrating climate science into food security and disaster risk management policy in Grenada. The Atlas should provide government, non-government and private entities with information that will guide development of policies, plans and strategies that contribute to climate change adaptation and disaster risk reduction.
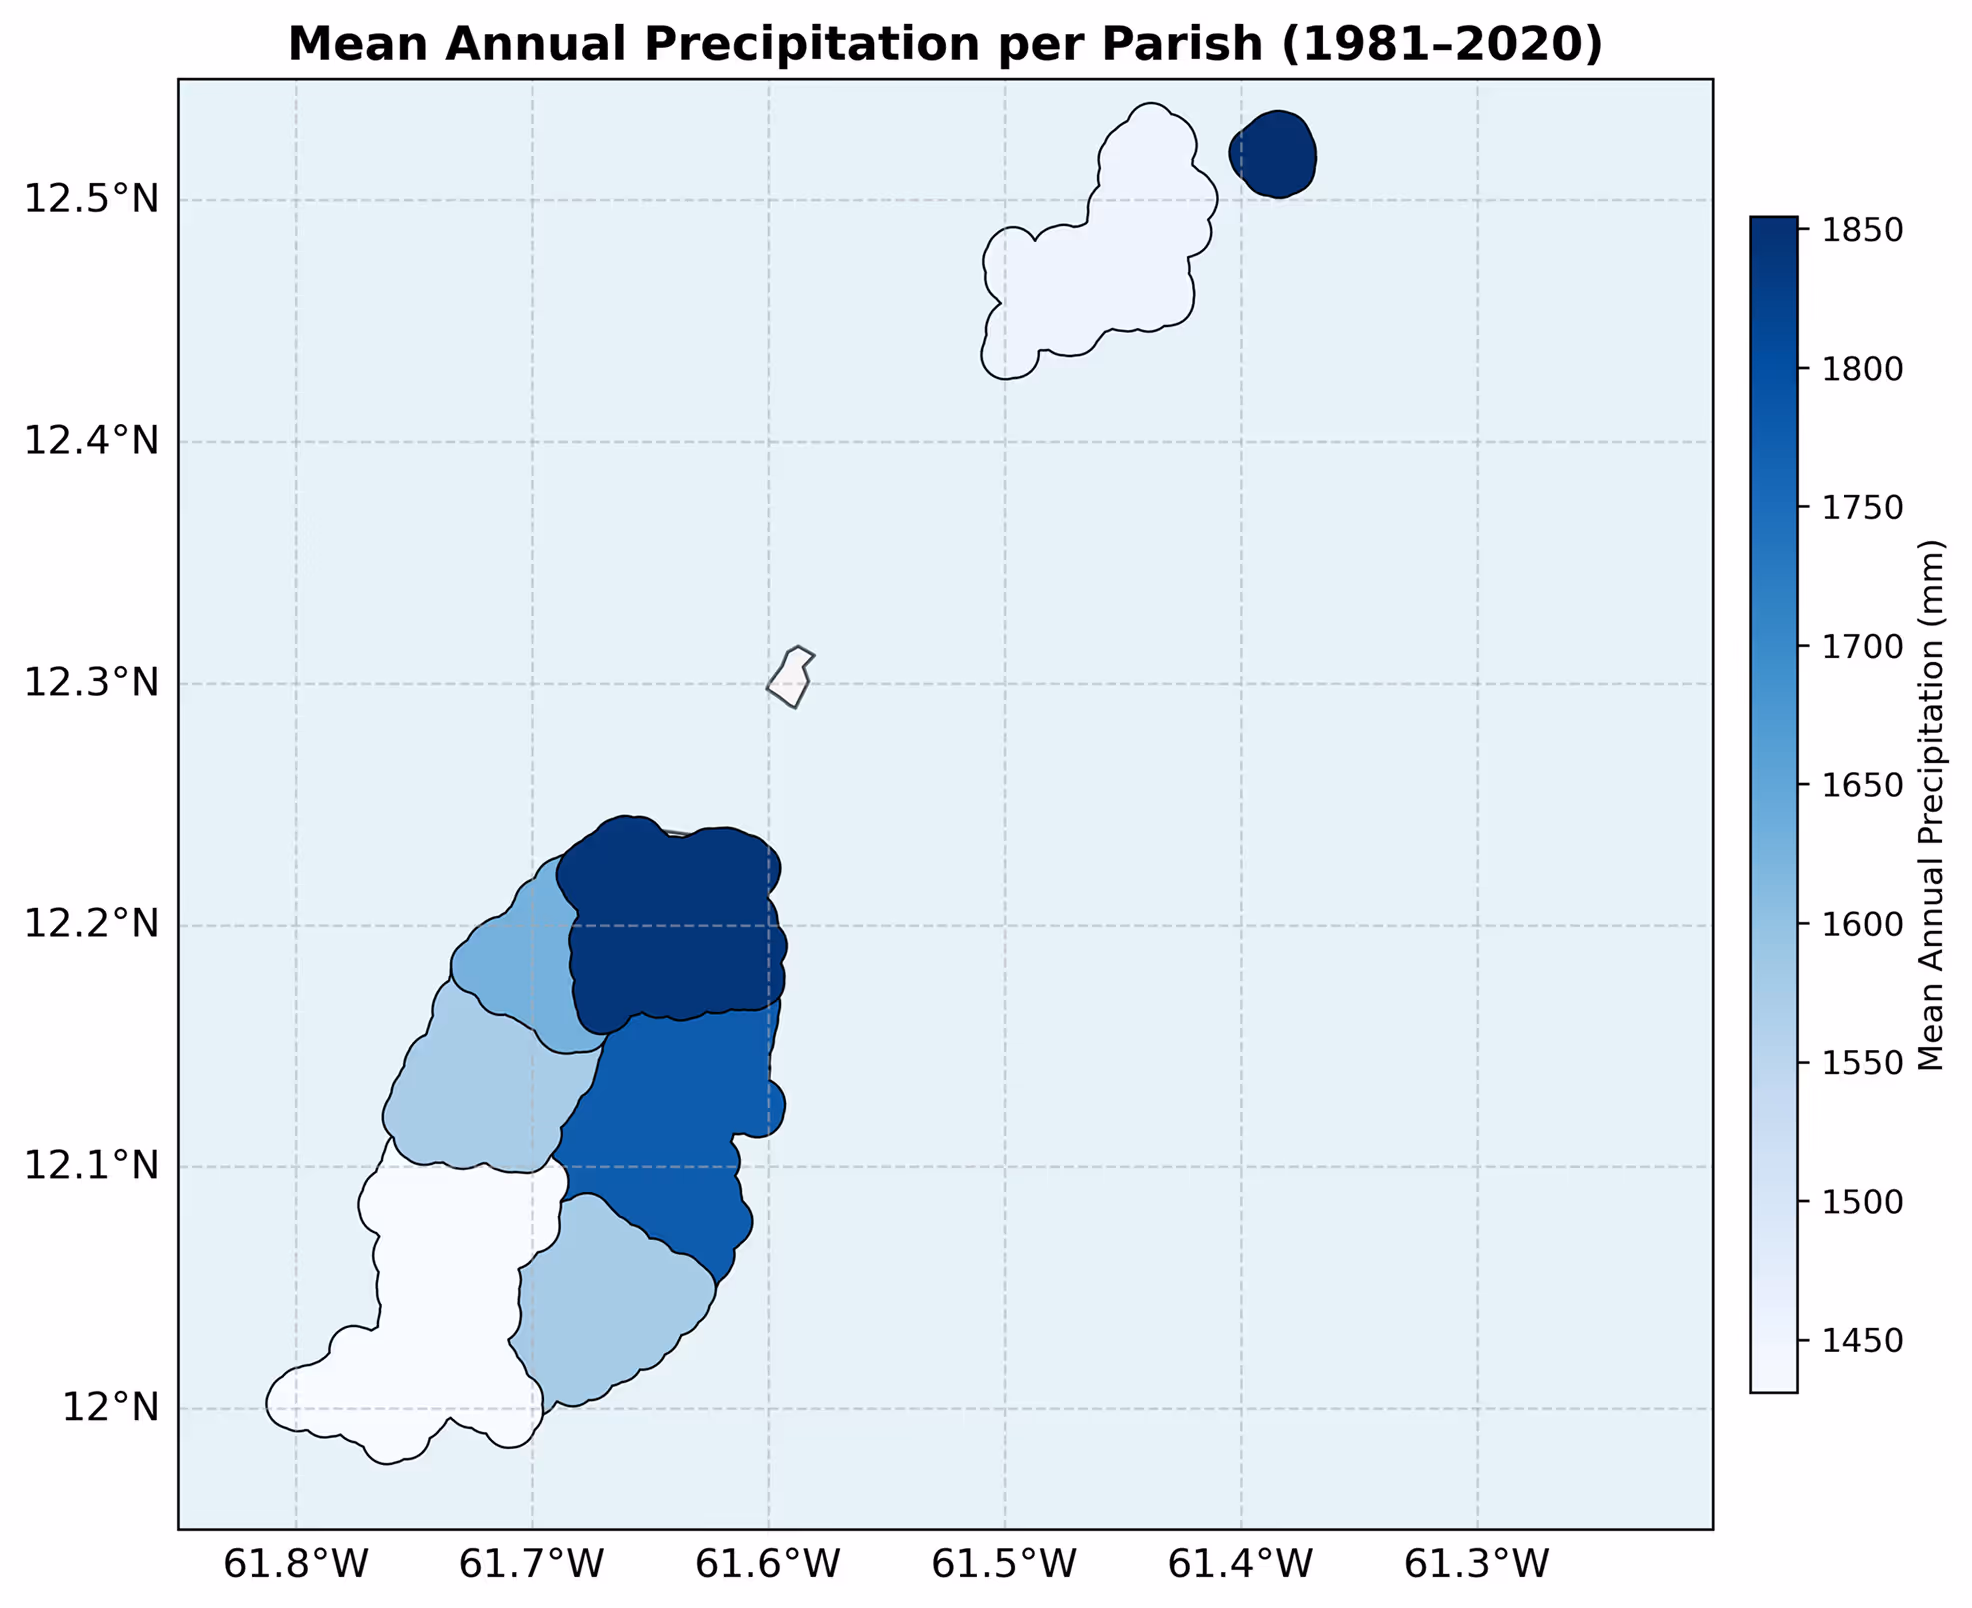
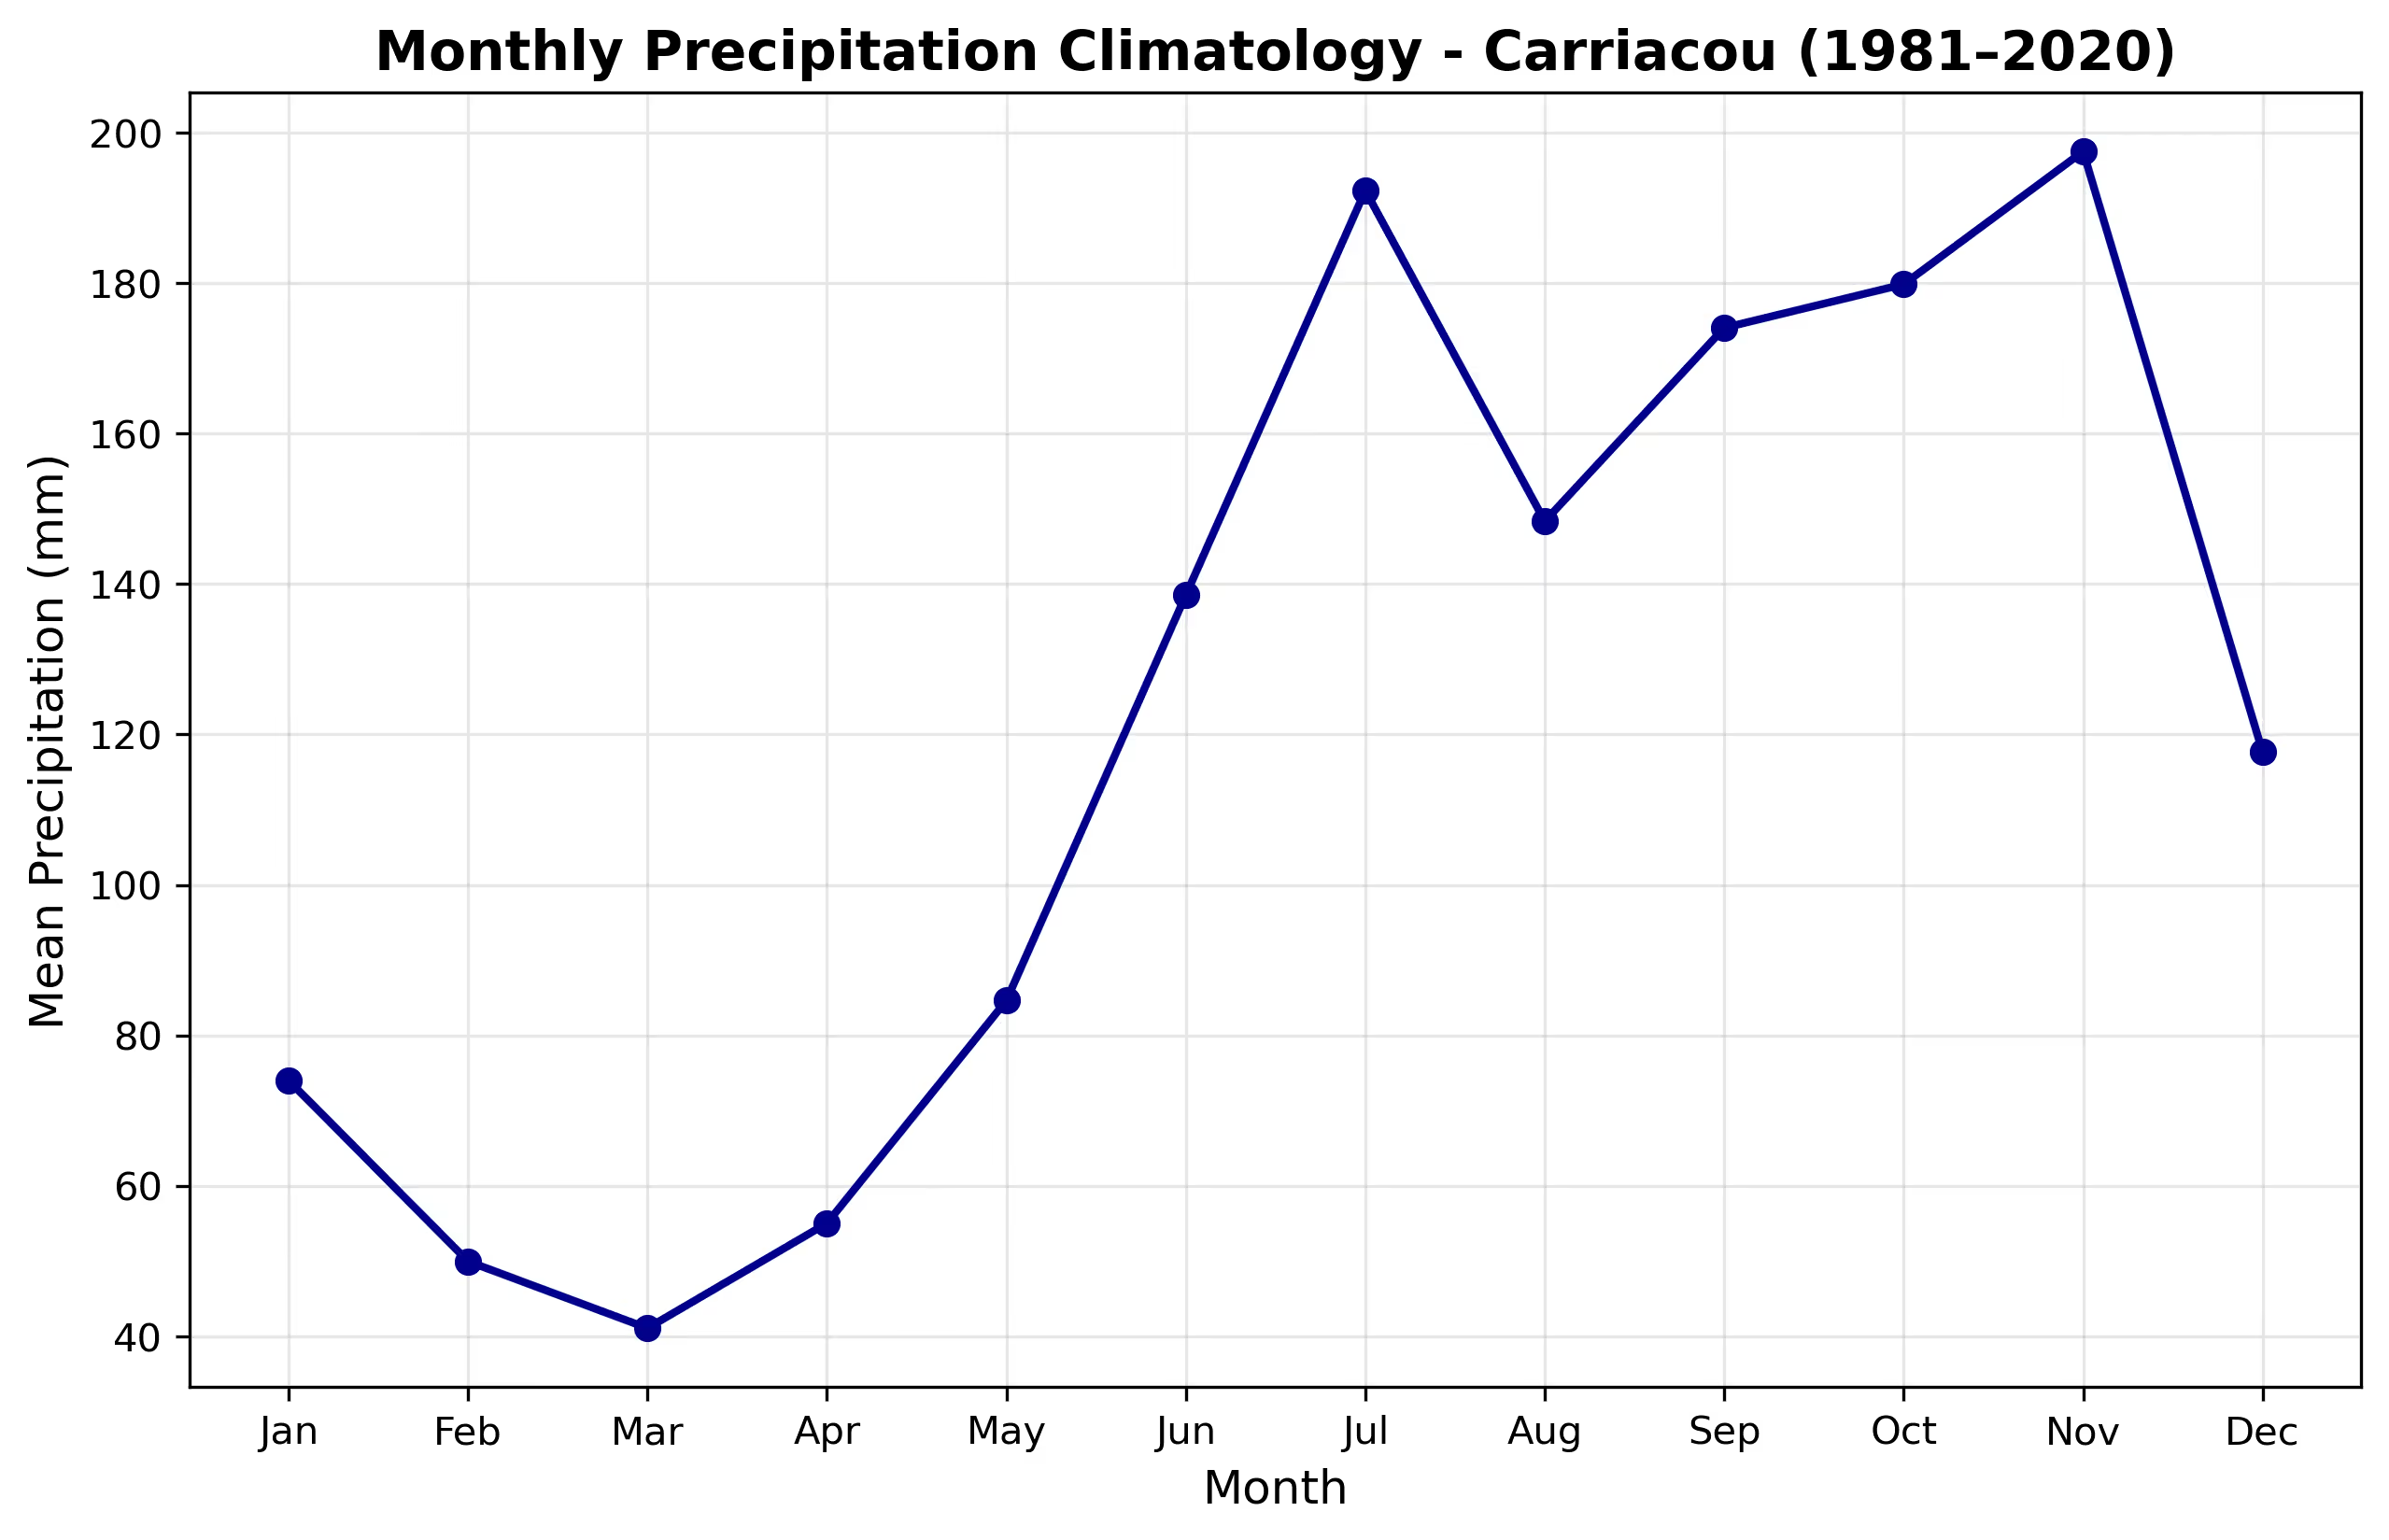
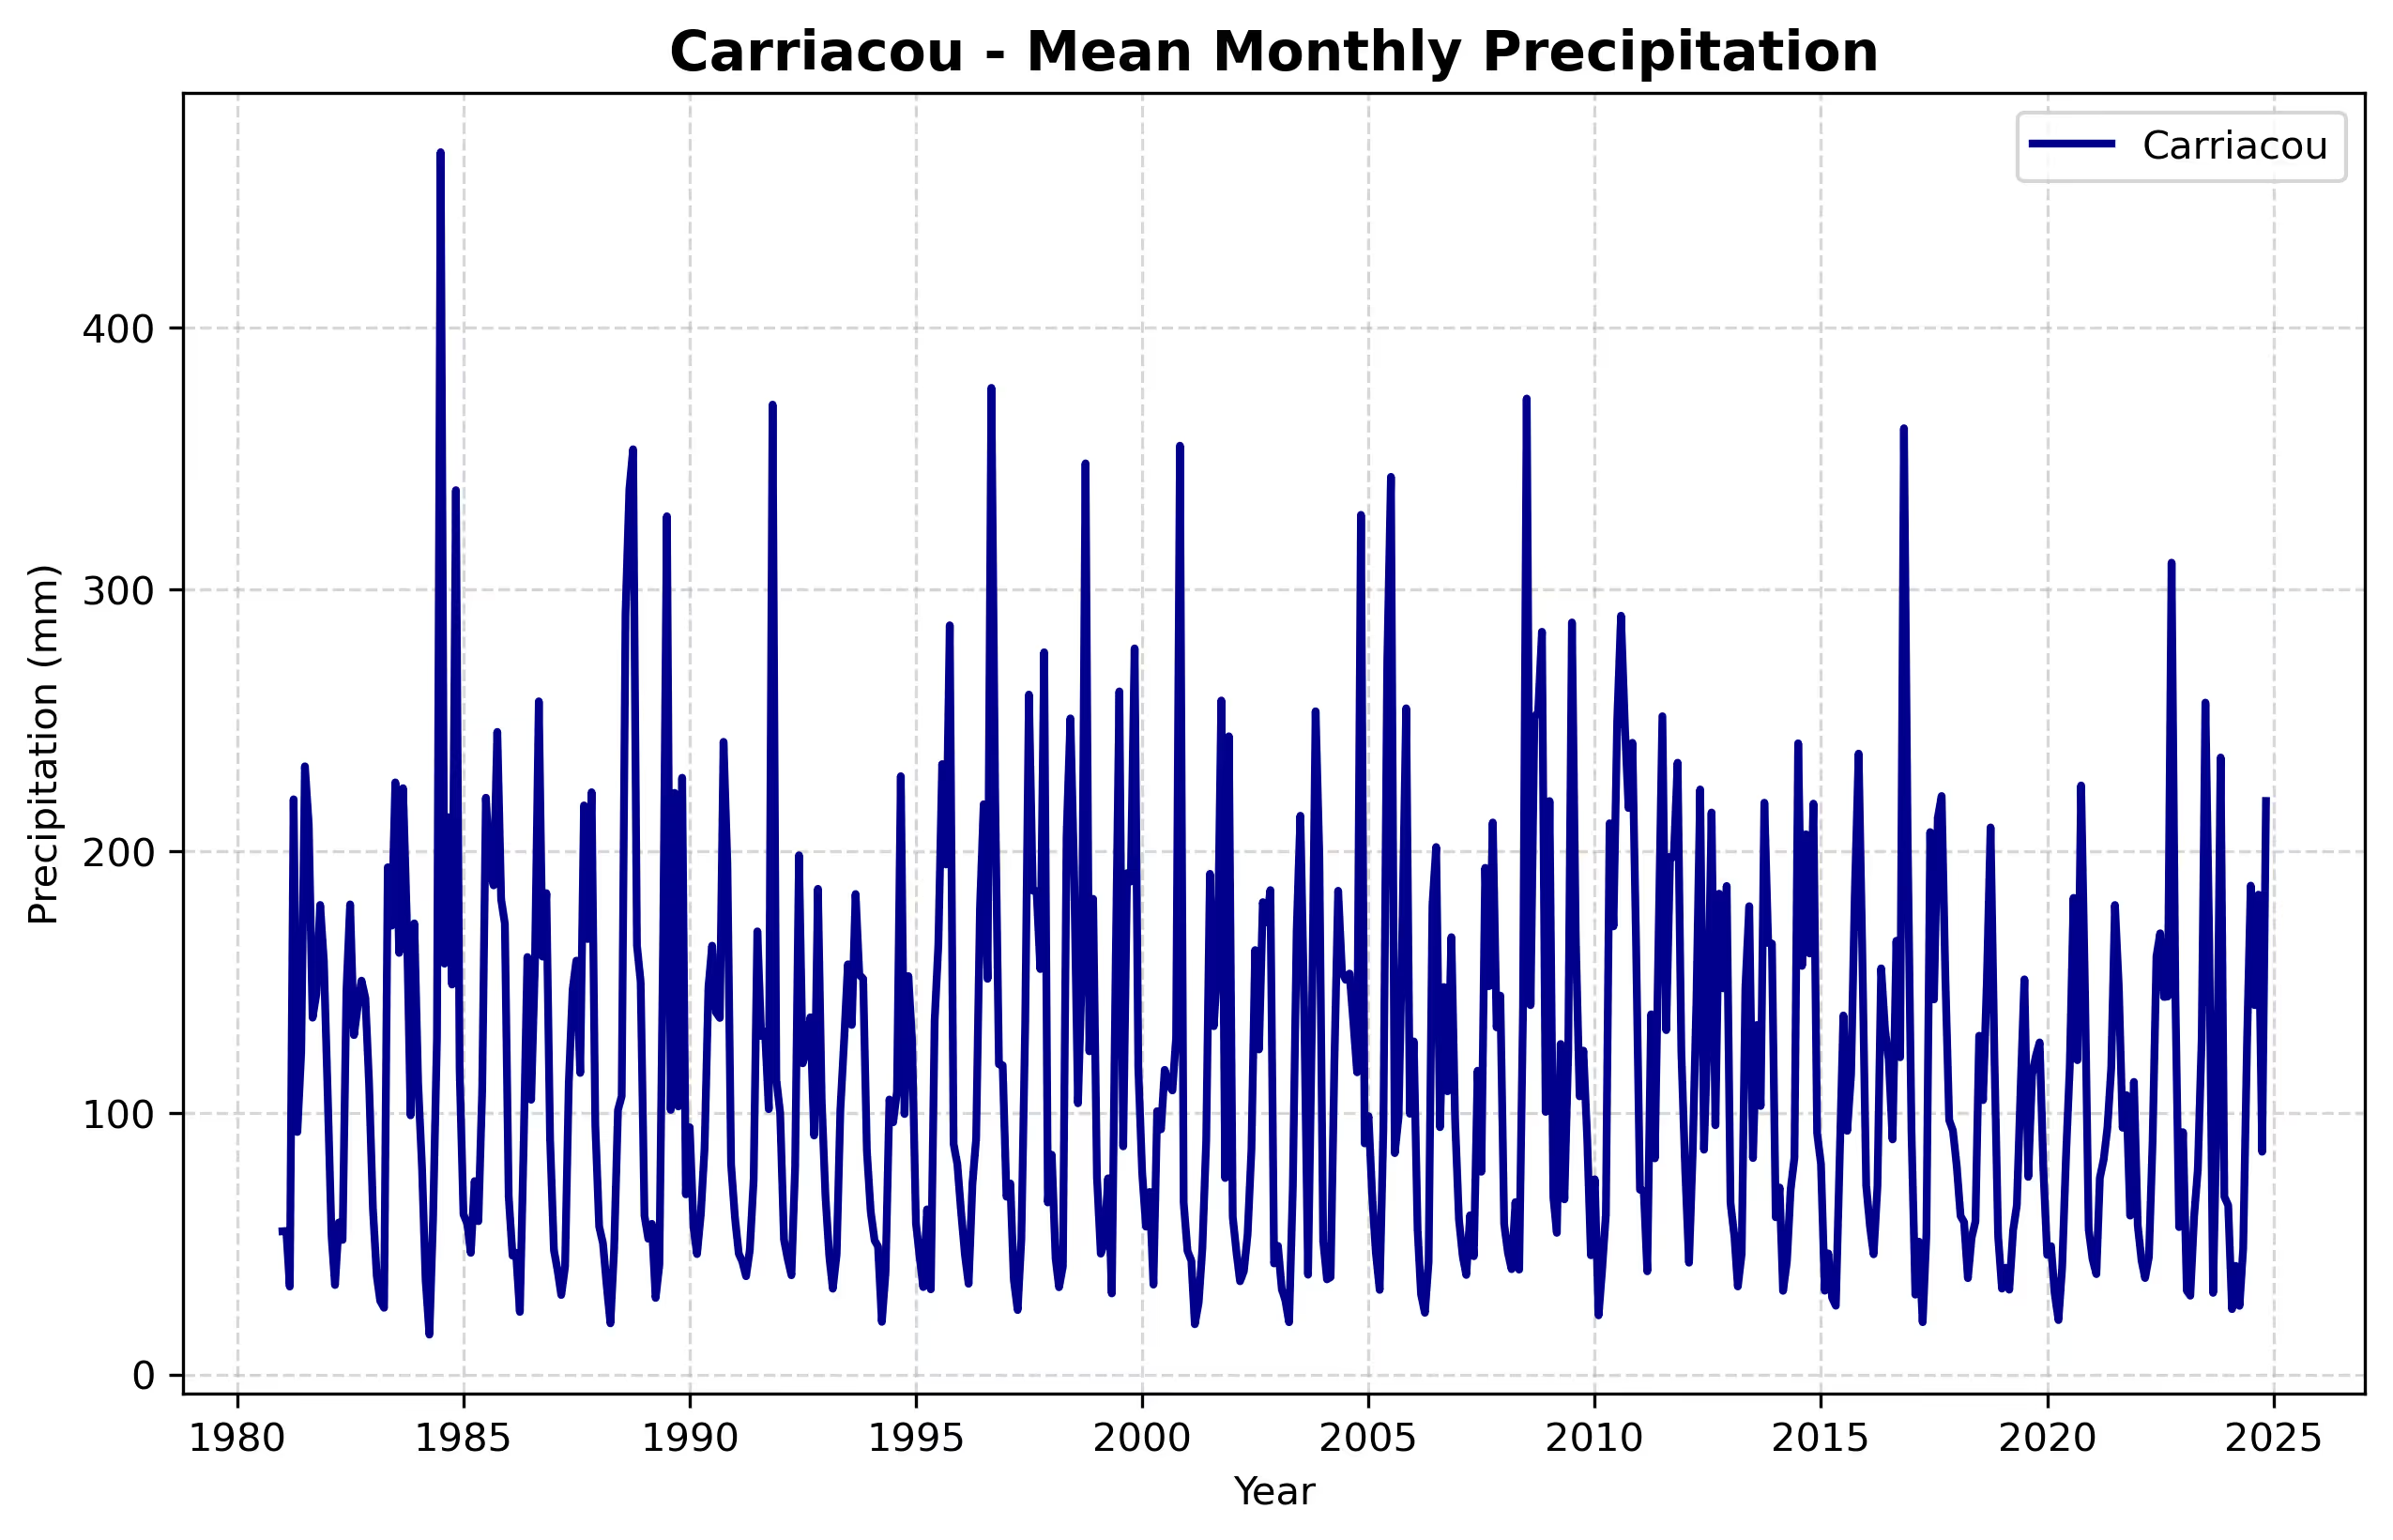
Monthly precipitation climatology represents the long-term average of rainfall for each month, providing insights into seasonal precipitation patterns across Carriacou. To compute this, CHIRPS precipitation data was clipped to Carriacou’s administrative boundaries and aggregated at the parish level using a nearest-grid approach to maintain spatial consistency. The monthly climatology was derived by averaging precipitation values for each month over the study period (1990–2020), allowing for the characterization of the seasonal cycle and typical rainfall distribution throughout the year.
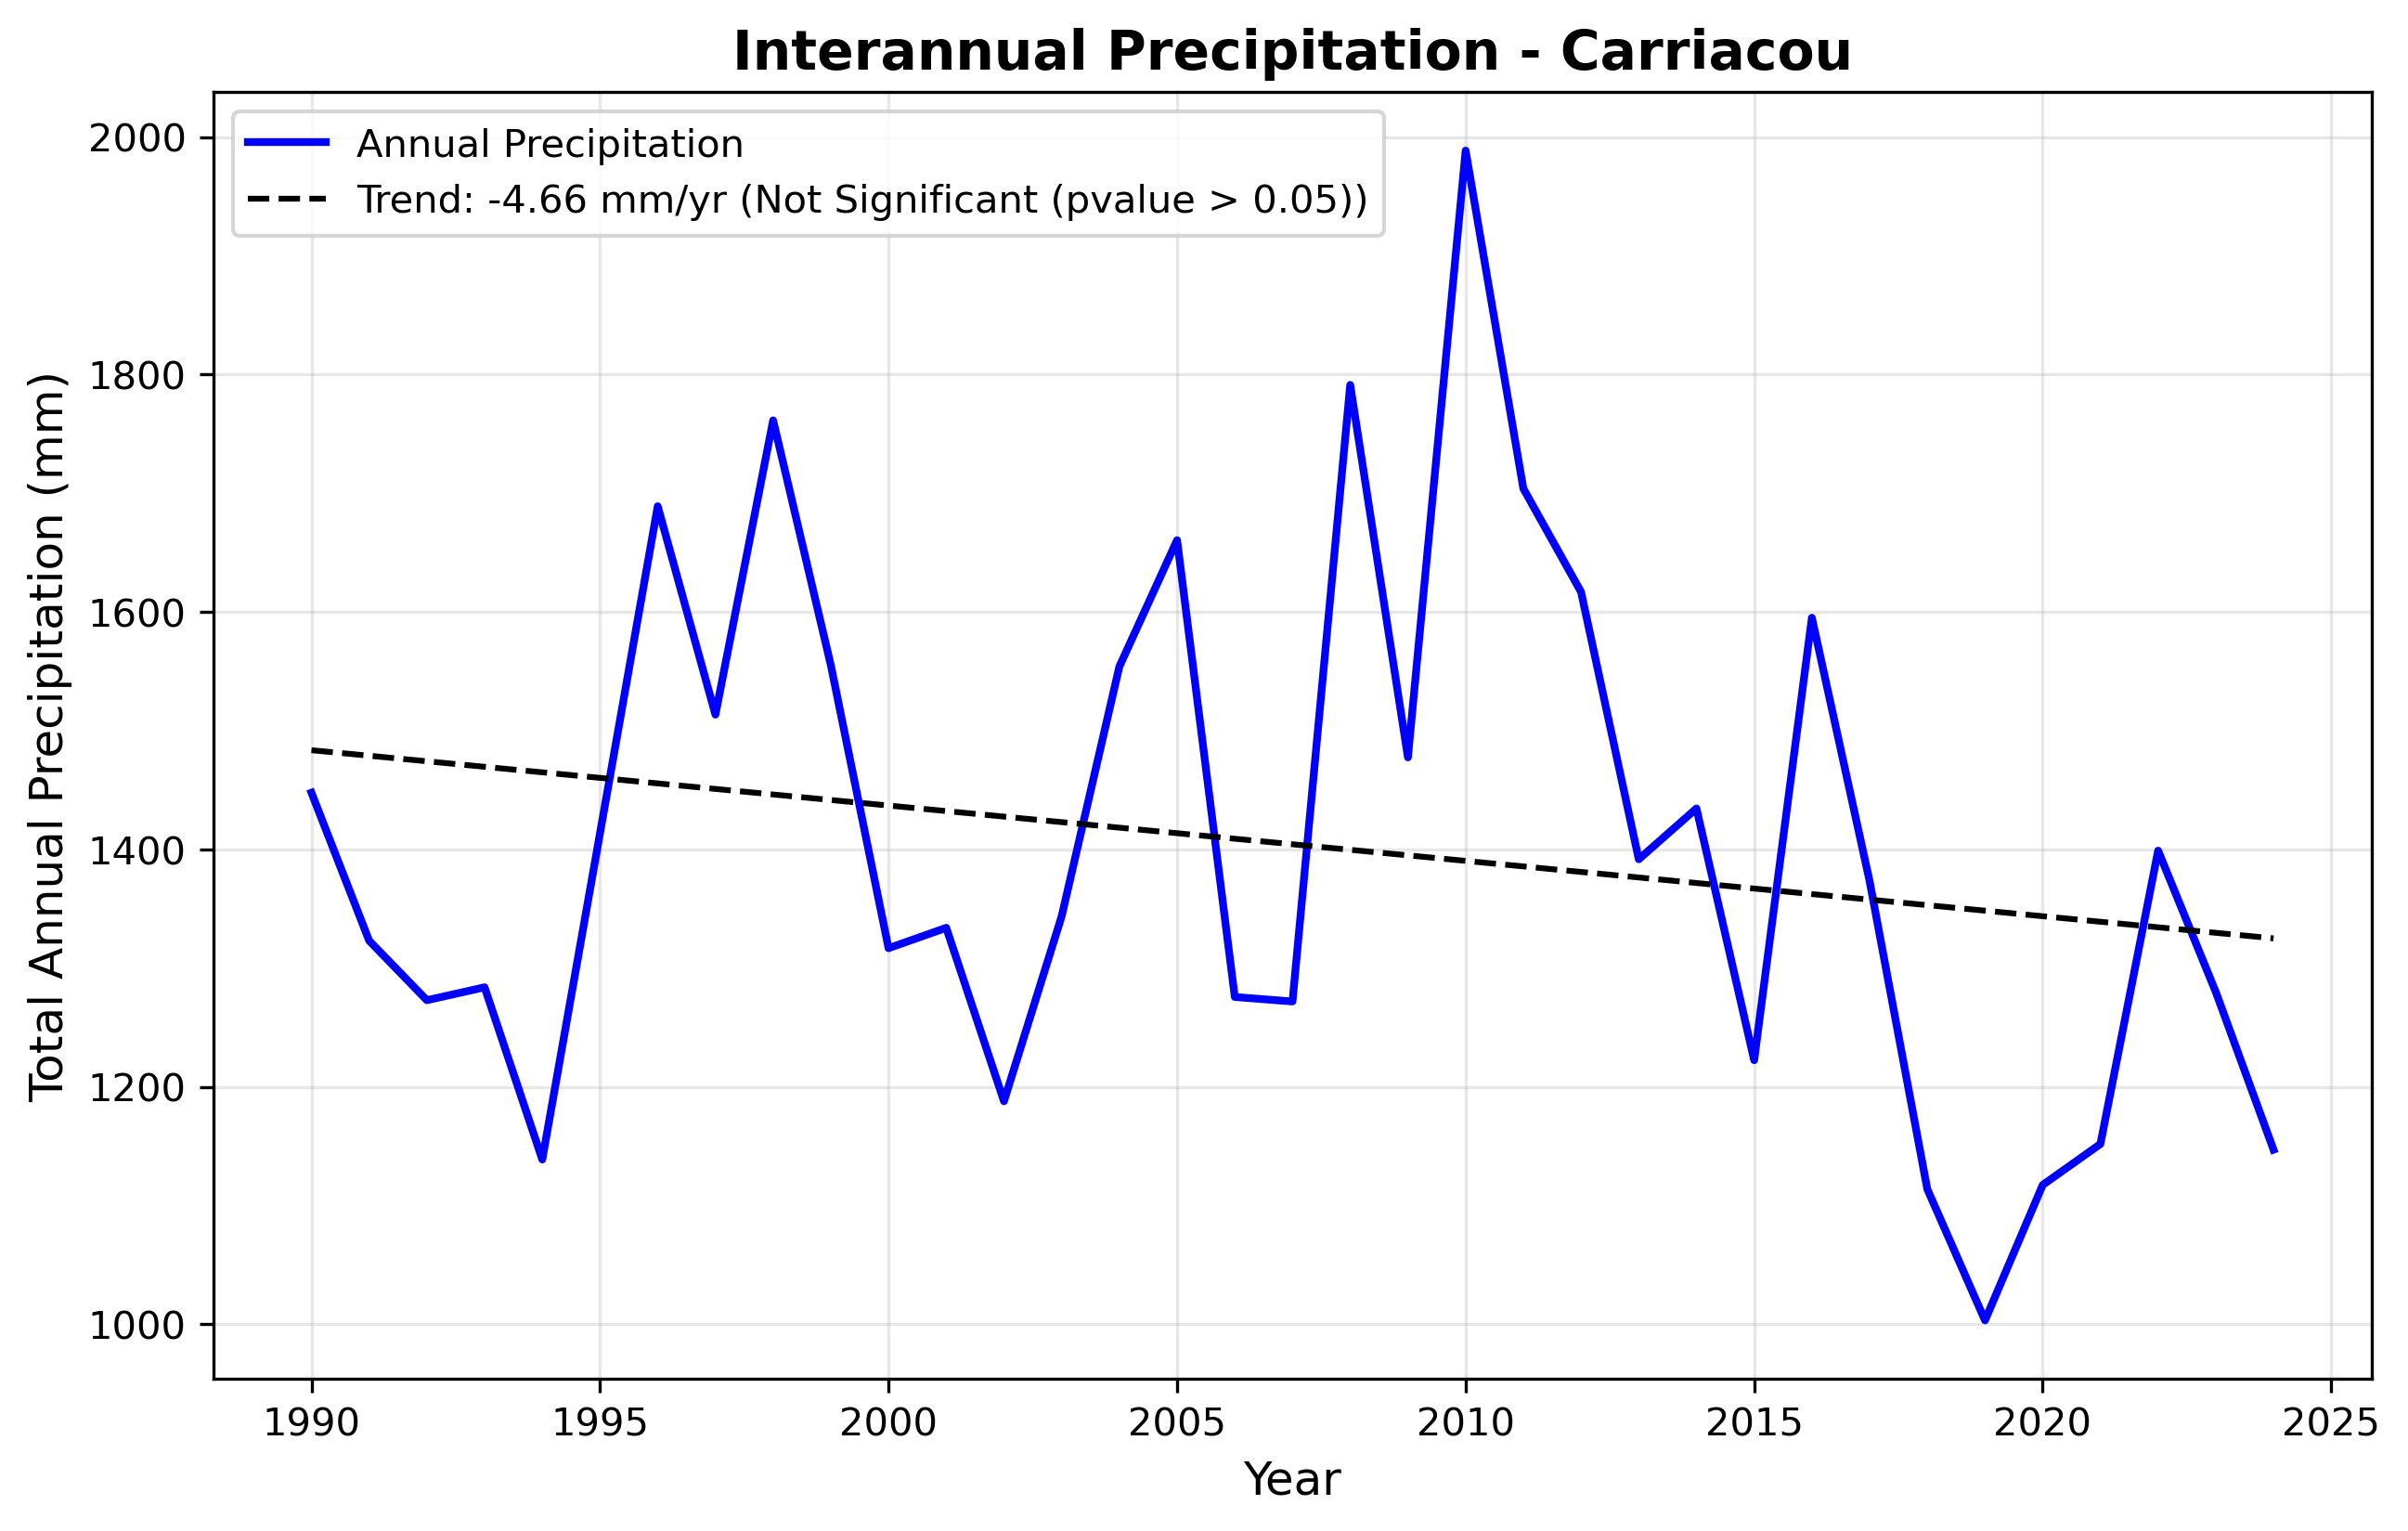
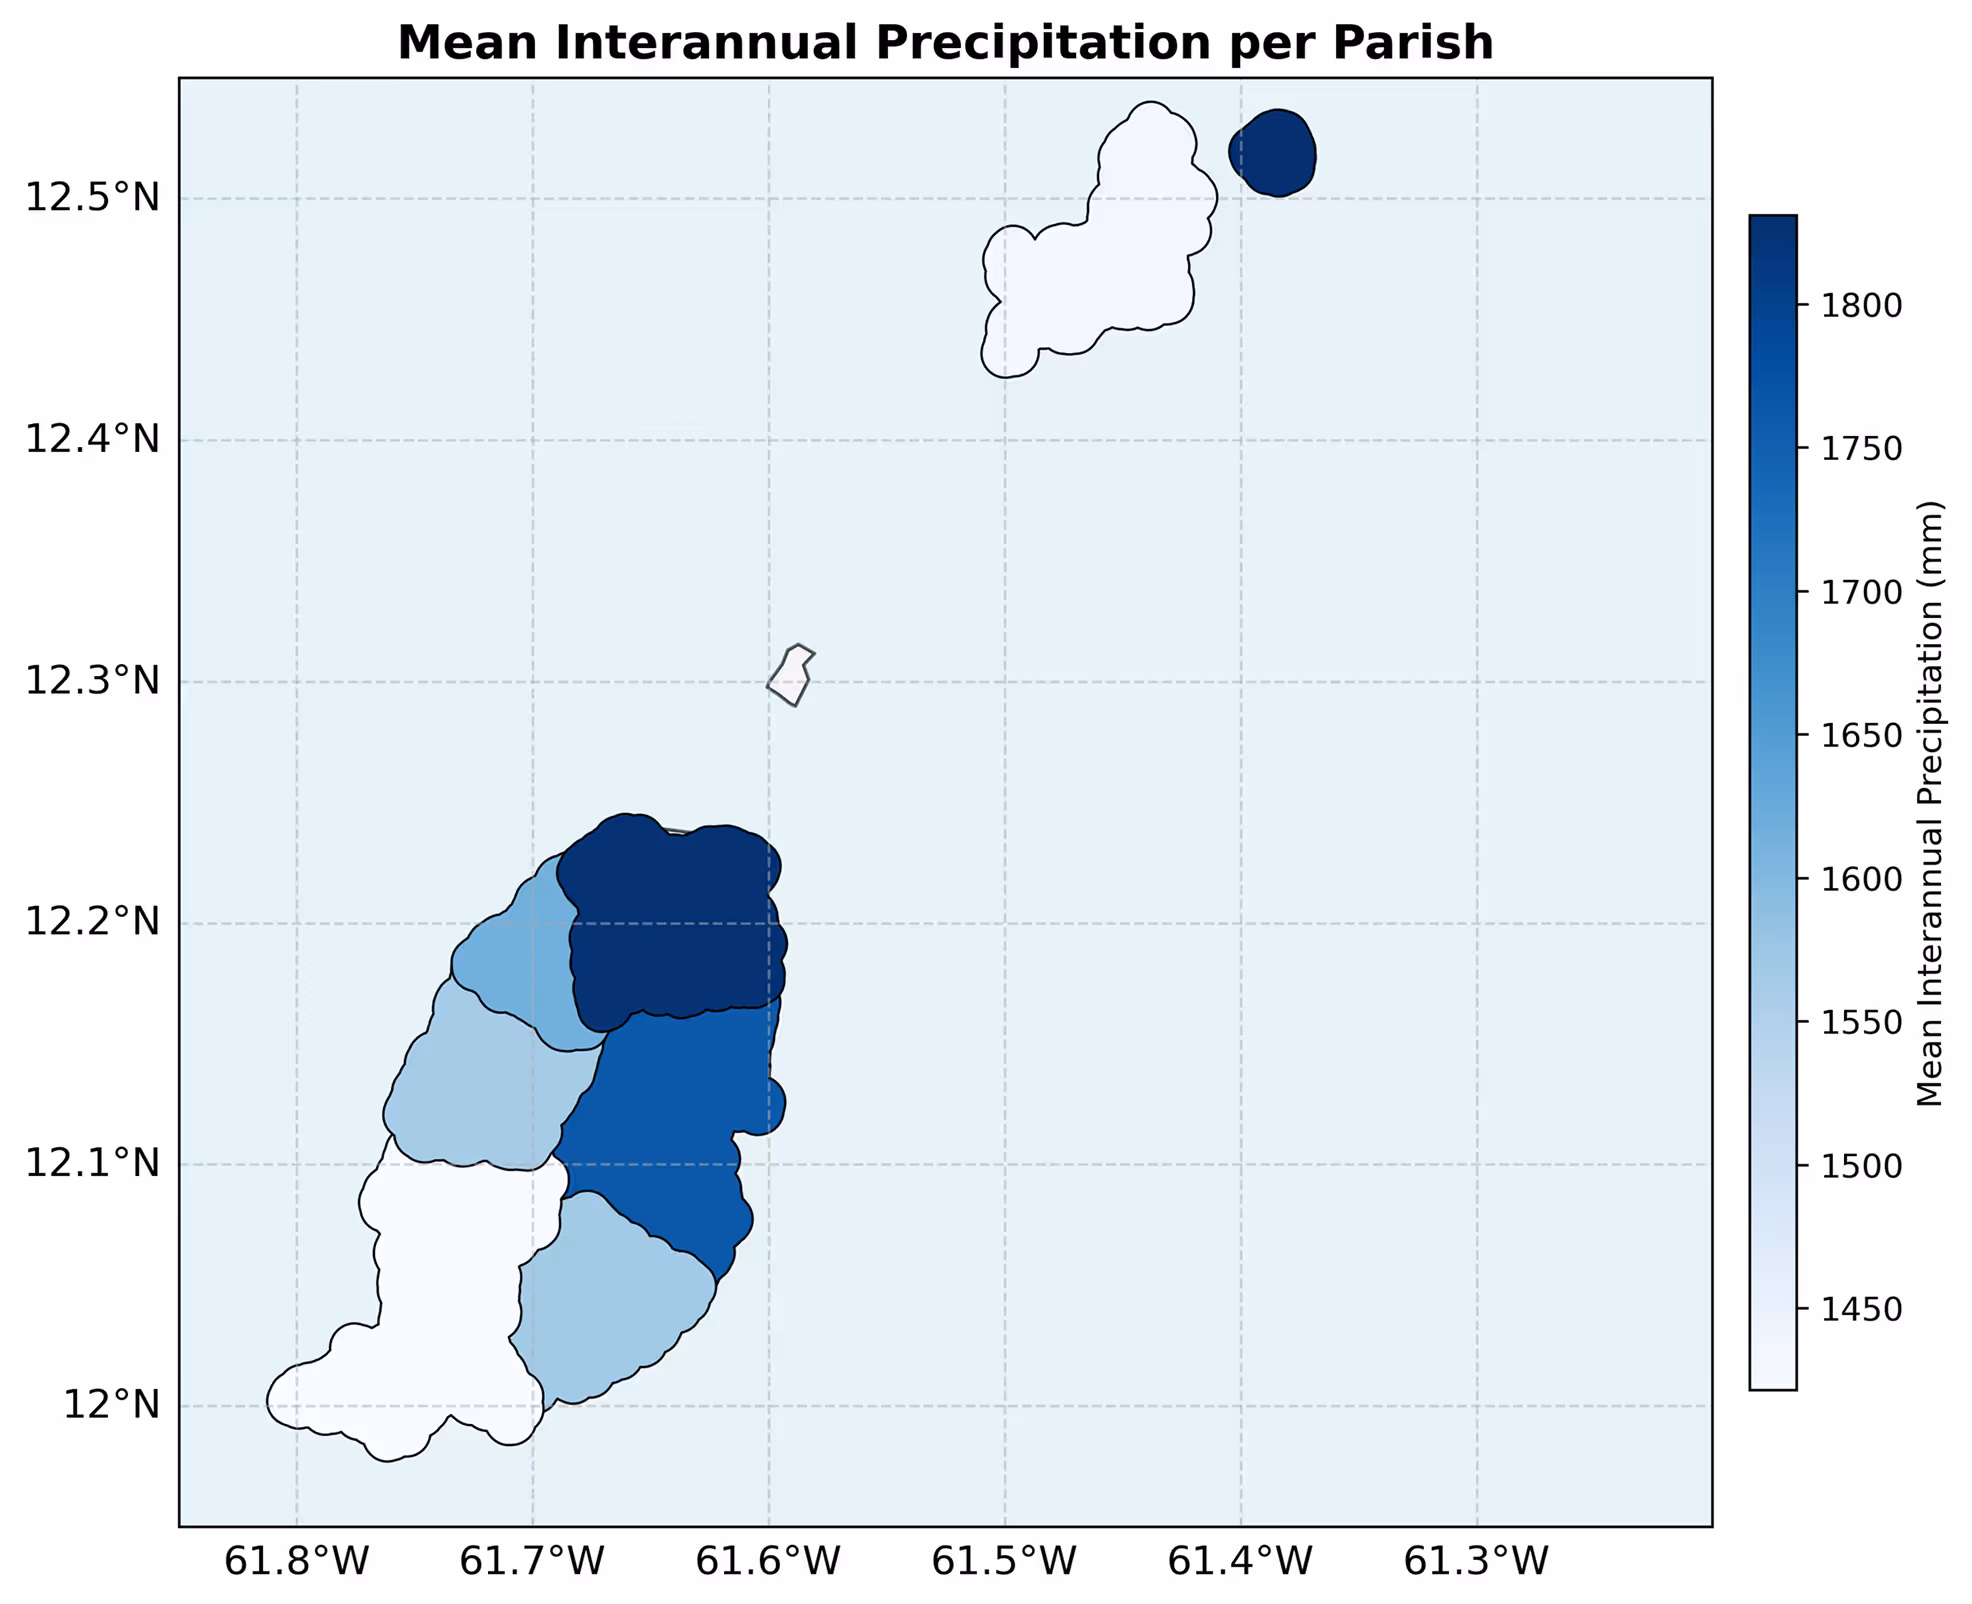
Interannual precipitation refers to the total annual rainfall, used to assess year-to-year variability in precipitation. CHIRPS precipitation data was processed by summing monthly precipitation values for each year, with the data clipped to Carriacou and aggregated at the parish level. This allows for an evaluation of overall rainfall patterns, detection of extreme wet and dry years, and analysis of trends over time to identify potential shifts in precipitation linked to climate variability and change.
Monthly precipitation captures the total rainfall recorded for each month, highlighting short-term variability. CHIRPS data was processed by extracting monthly precipitation values per parish, maintaining spatial consistency through a nearest-grid method.
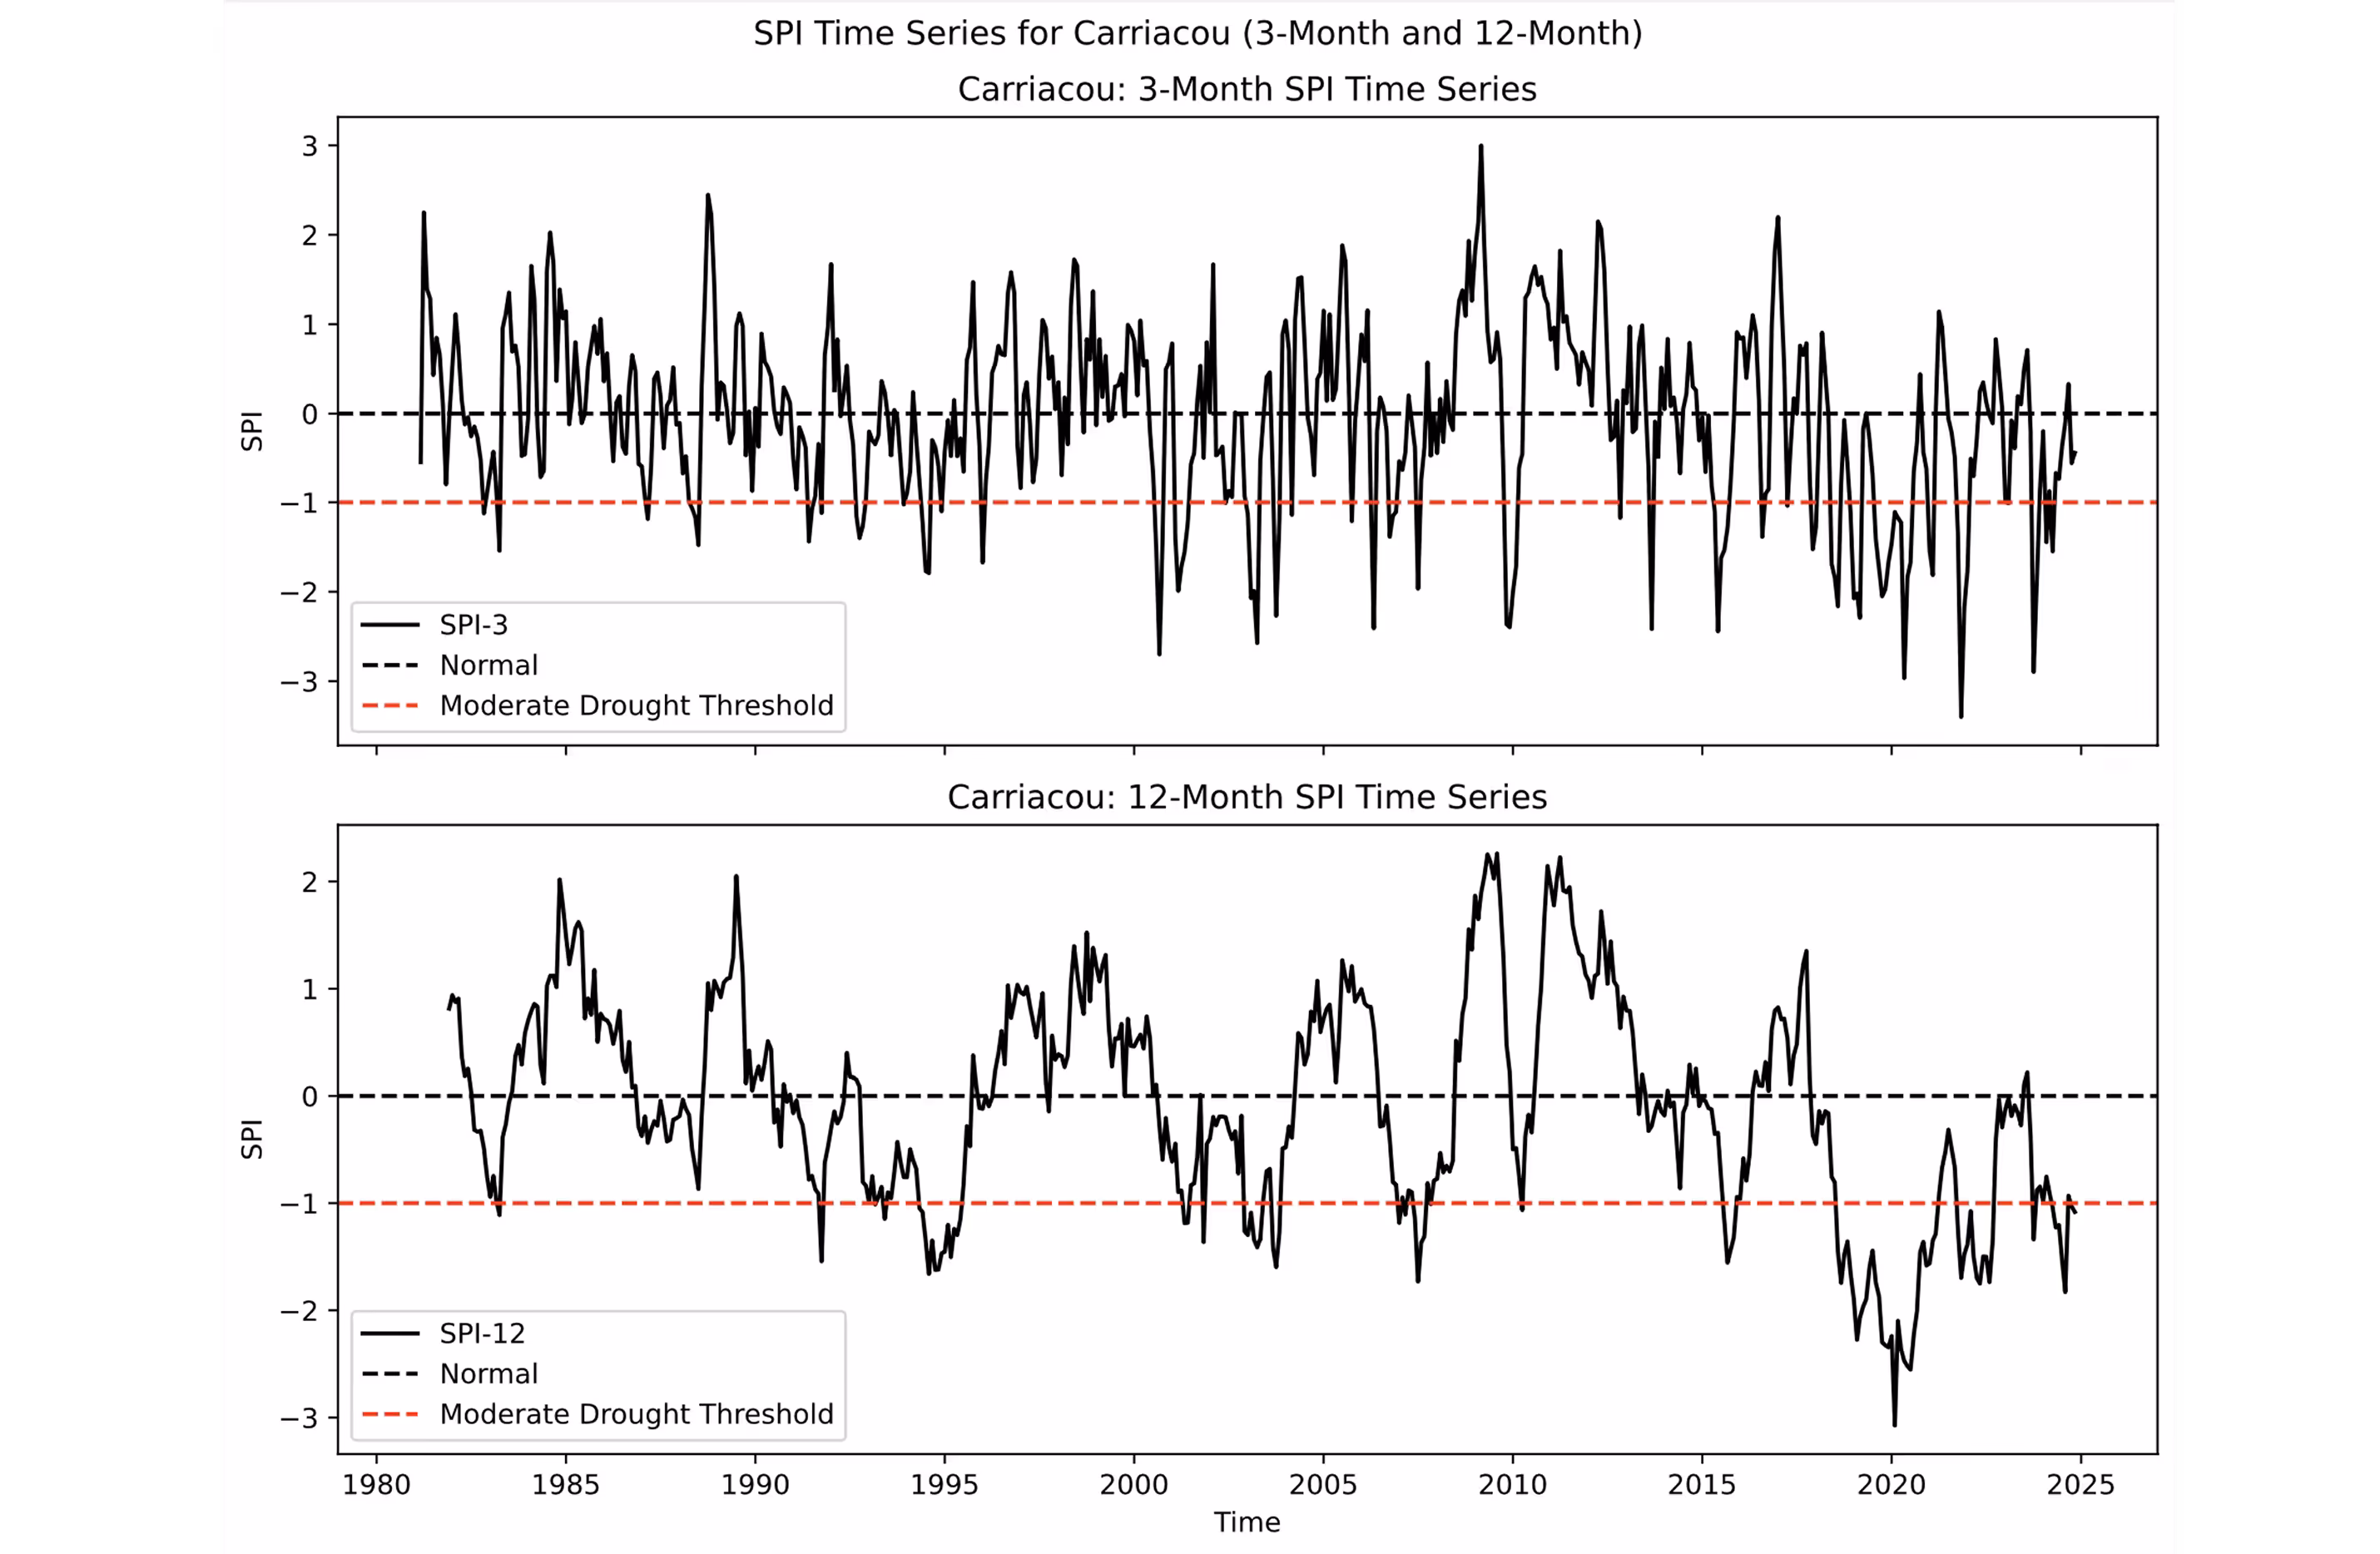
The Standardized Precipitation Index (SPI) is used to measure precipitation anomalies over different time scales. SPI-3 reflects short-term wet or dry conditions by analyzing precipitation over a three-month period, while SPI-12 assesses longer-term drought or wet periods by considering a twelve-month accumulation. The SPI-12 was calculated from the CHIRPS precipitation dataset for the period 1984–2024.
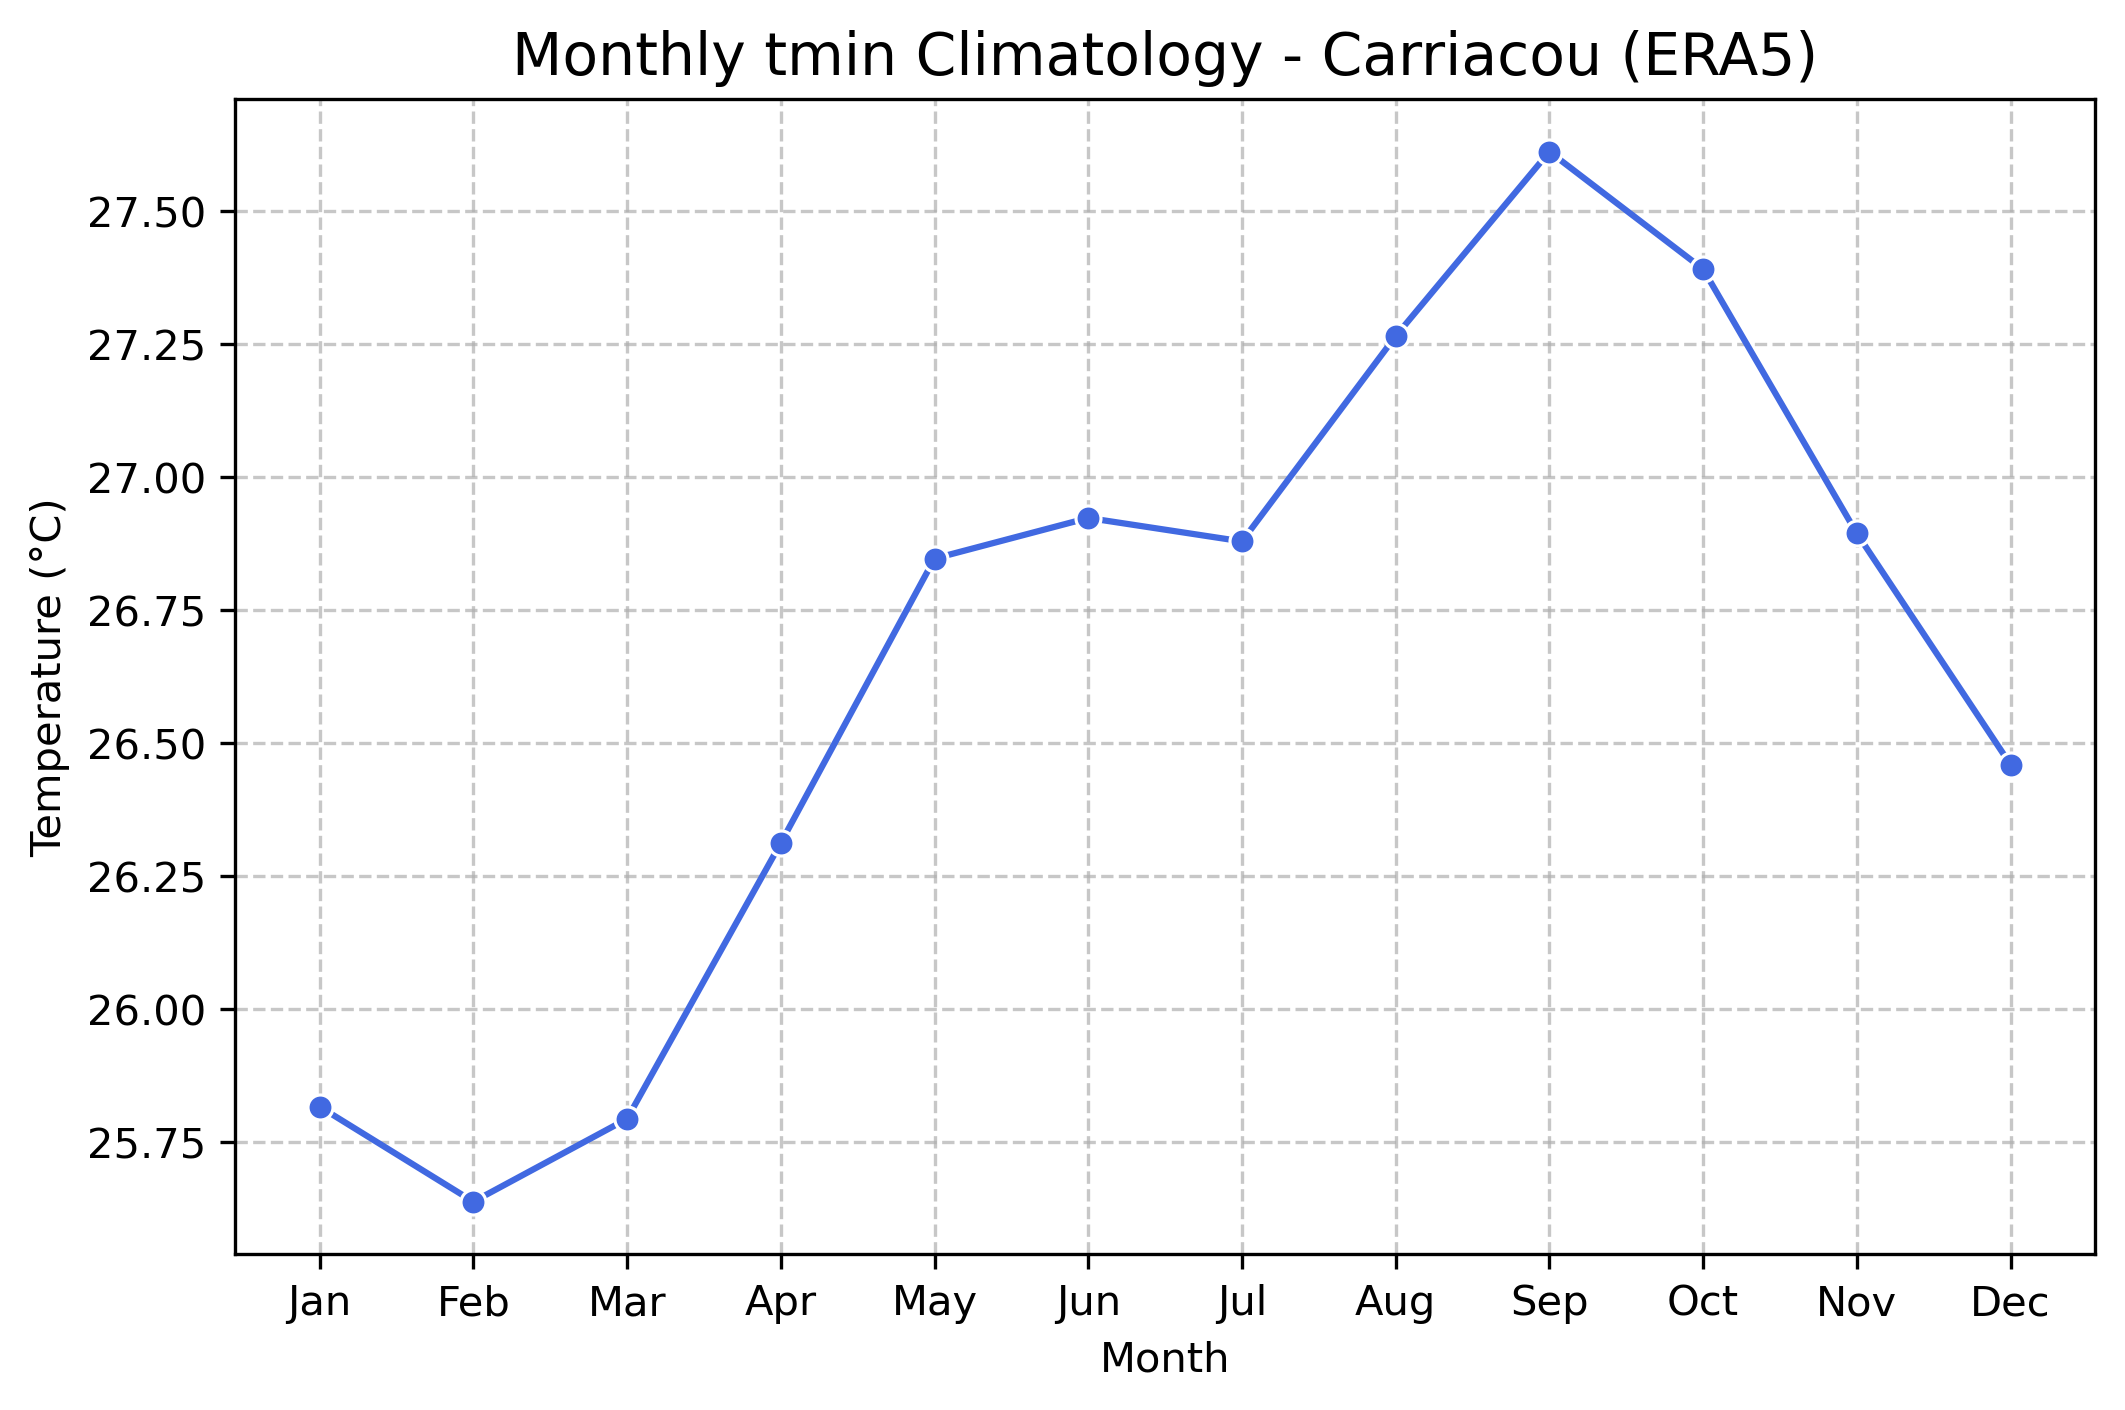
Temperature climatology represents the long-term average of mean, minimum, and maximum temperatures over a reference period, characterizing the typical seasonal cycle of temperature variations in Grenada. ERA5 temperature data was clipped to the country’s administrative boundaries and aggregated at the parish level using a nearest-grid approach to ensure spatial consistency. Monthly climatological values were computed by averaging temperature records for each month over the study period, providing insights into expected temperature variations throughout the year.
%201.avif)

%201.avif)
%201.avif)

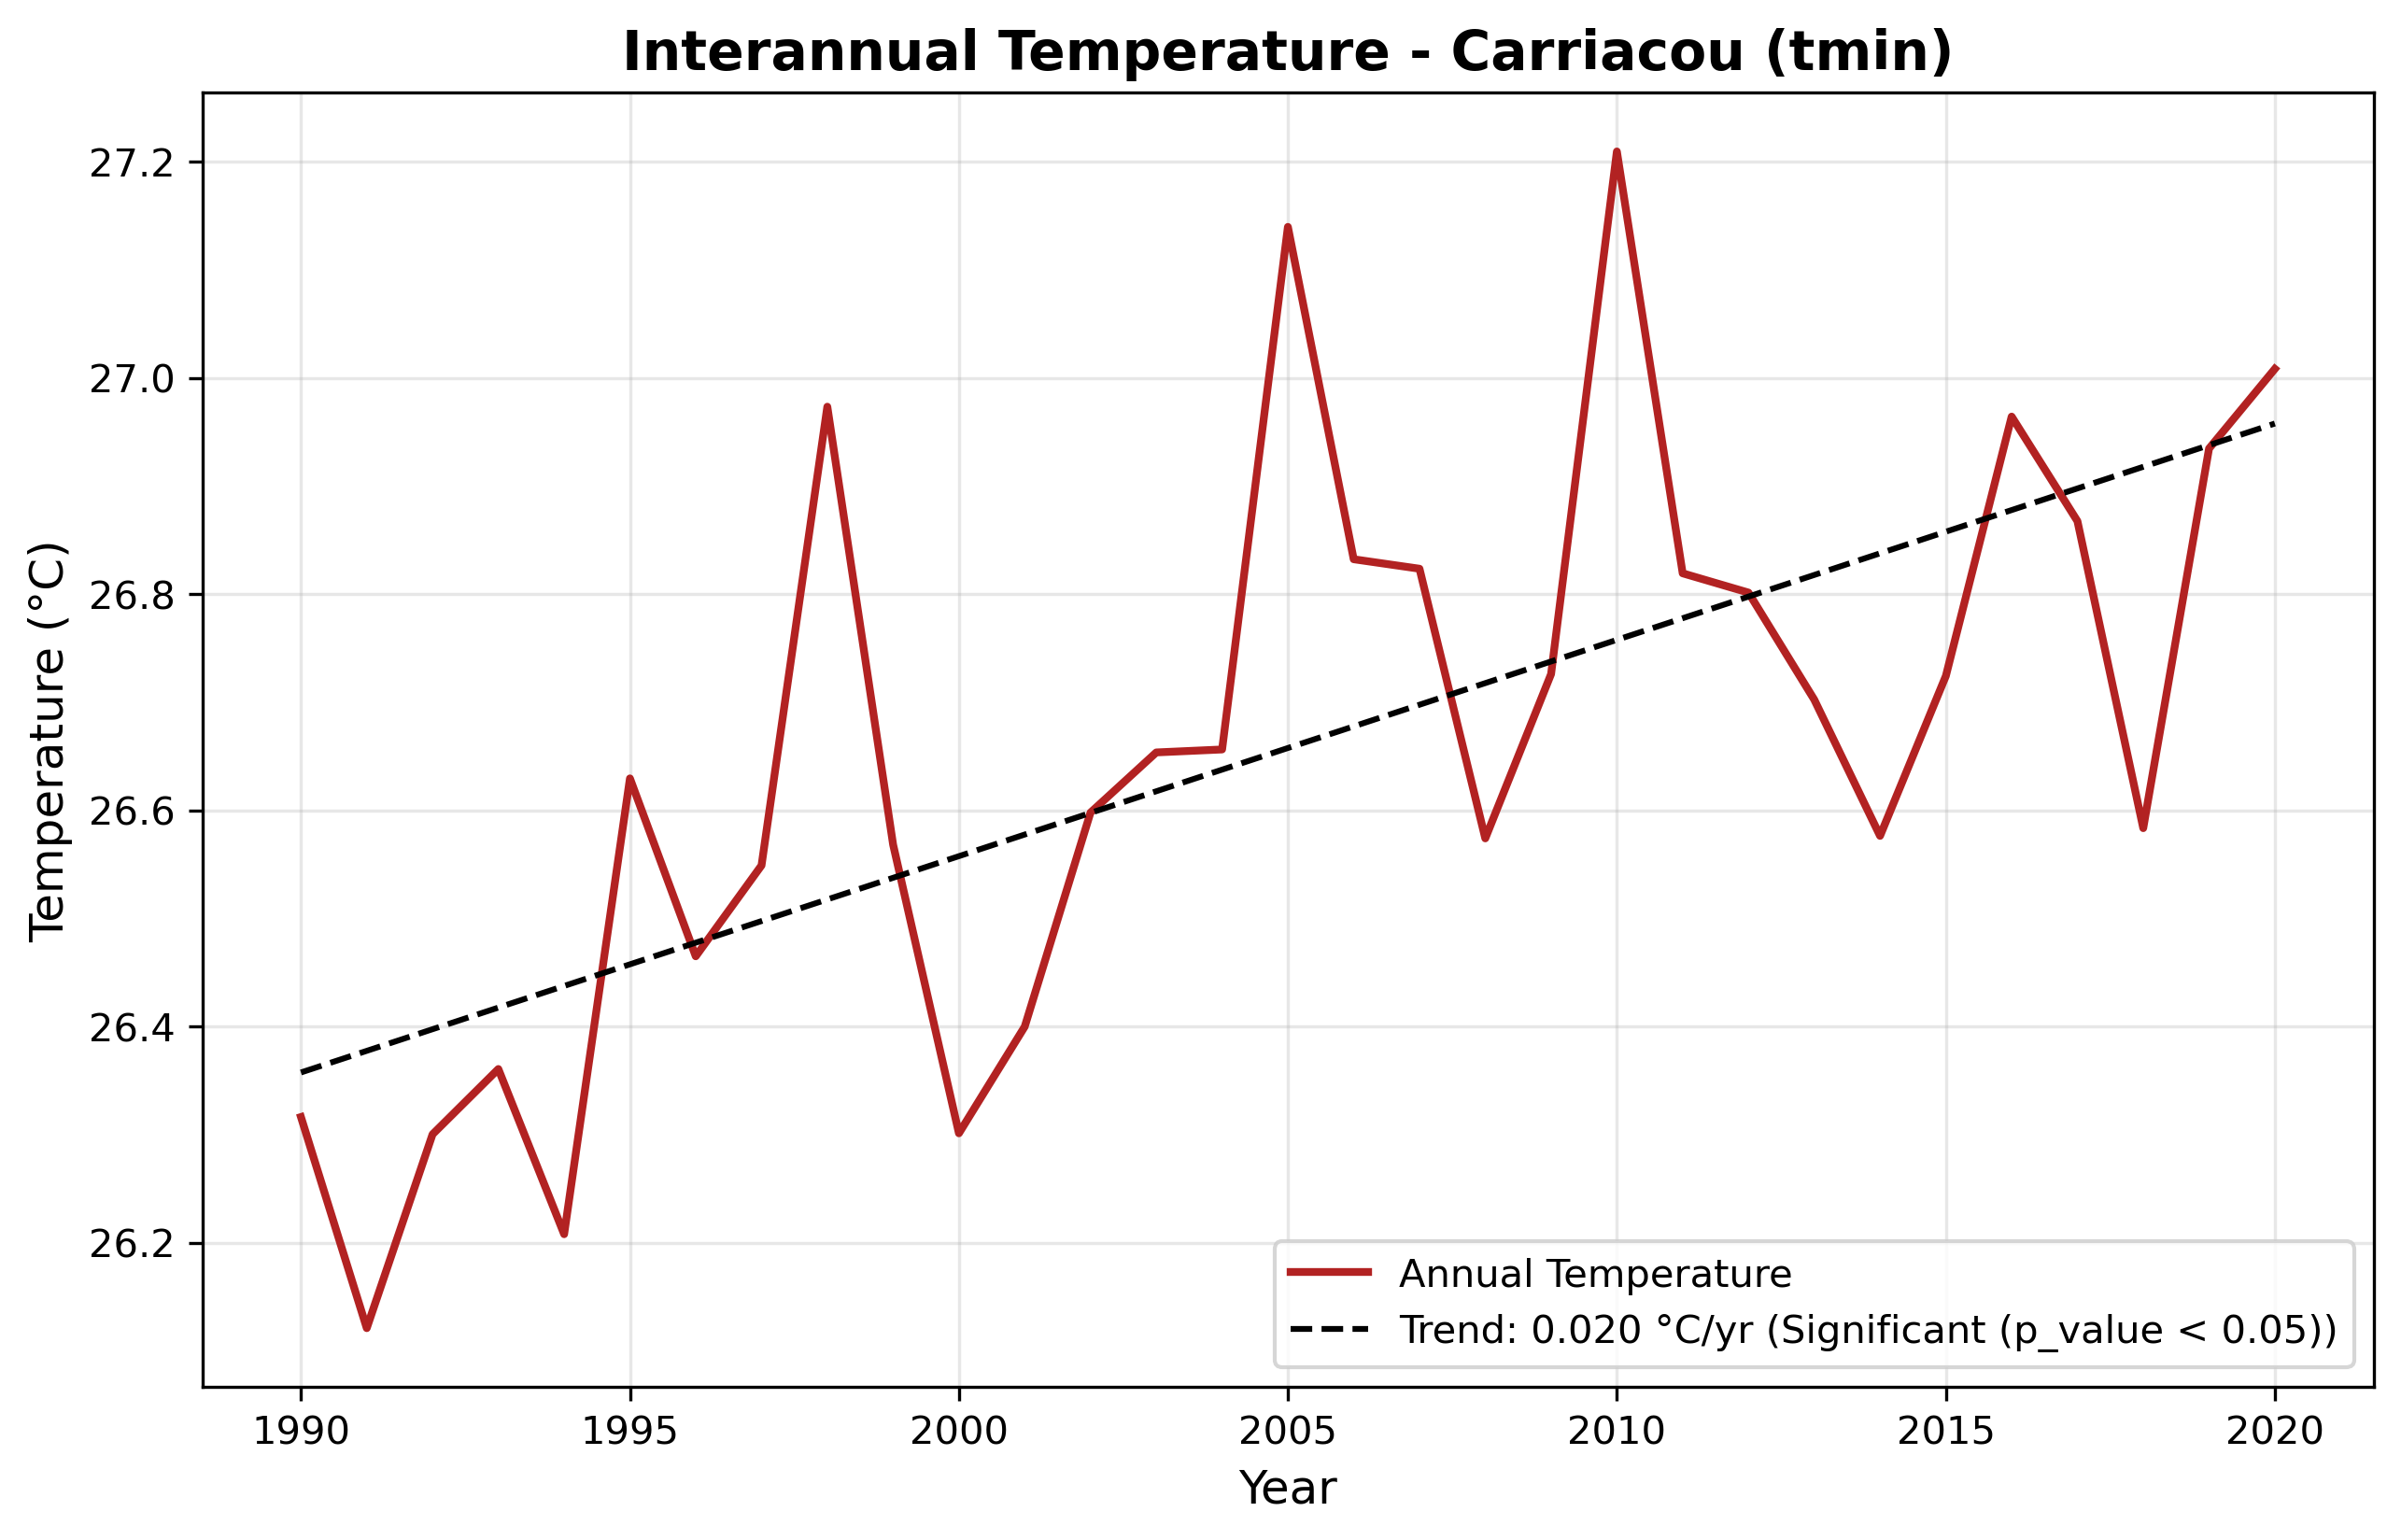
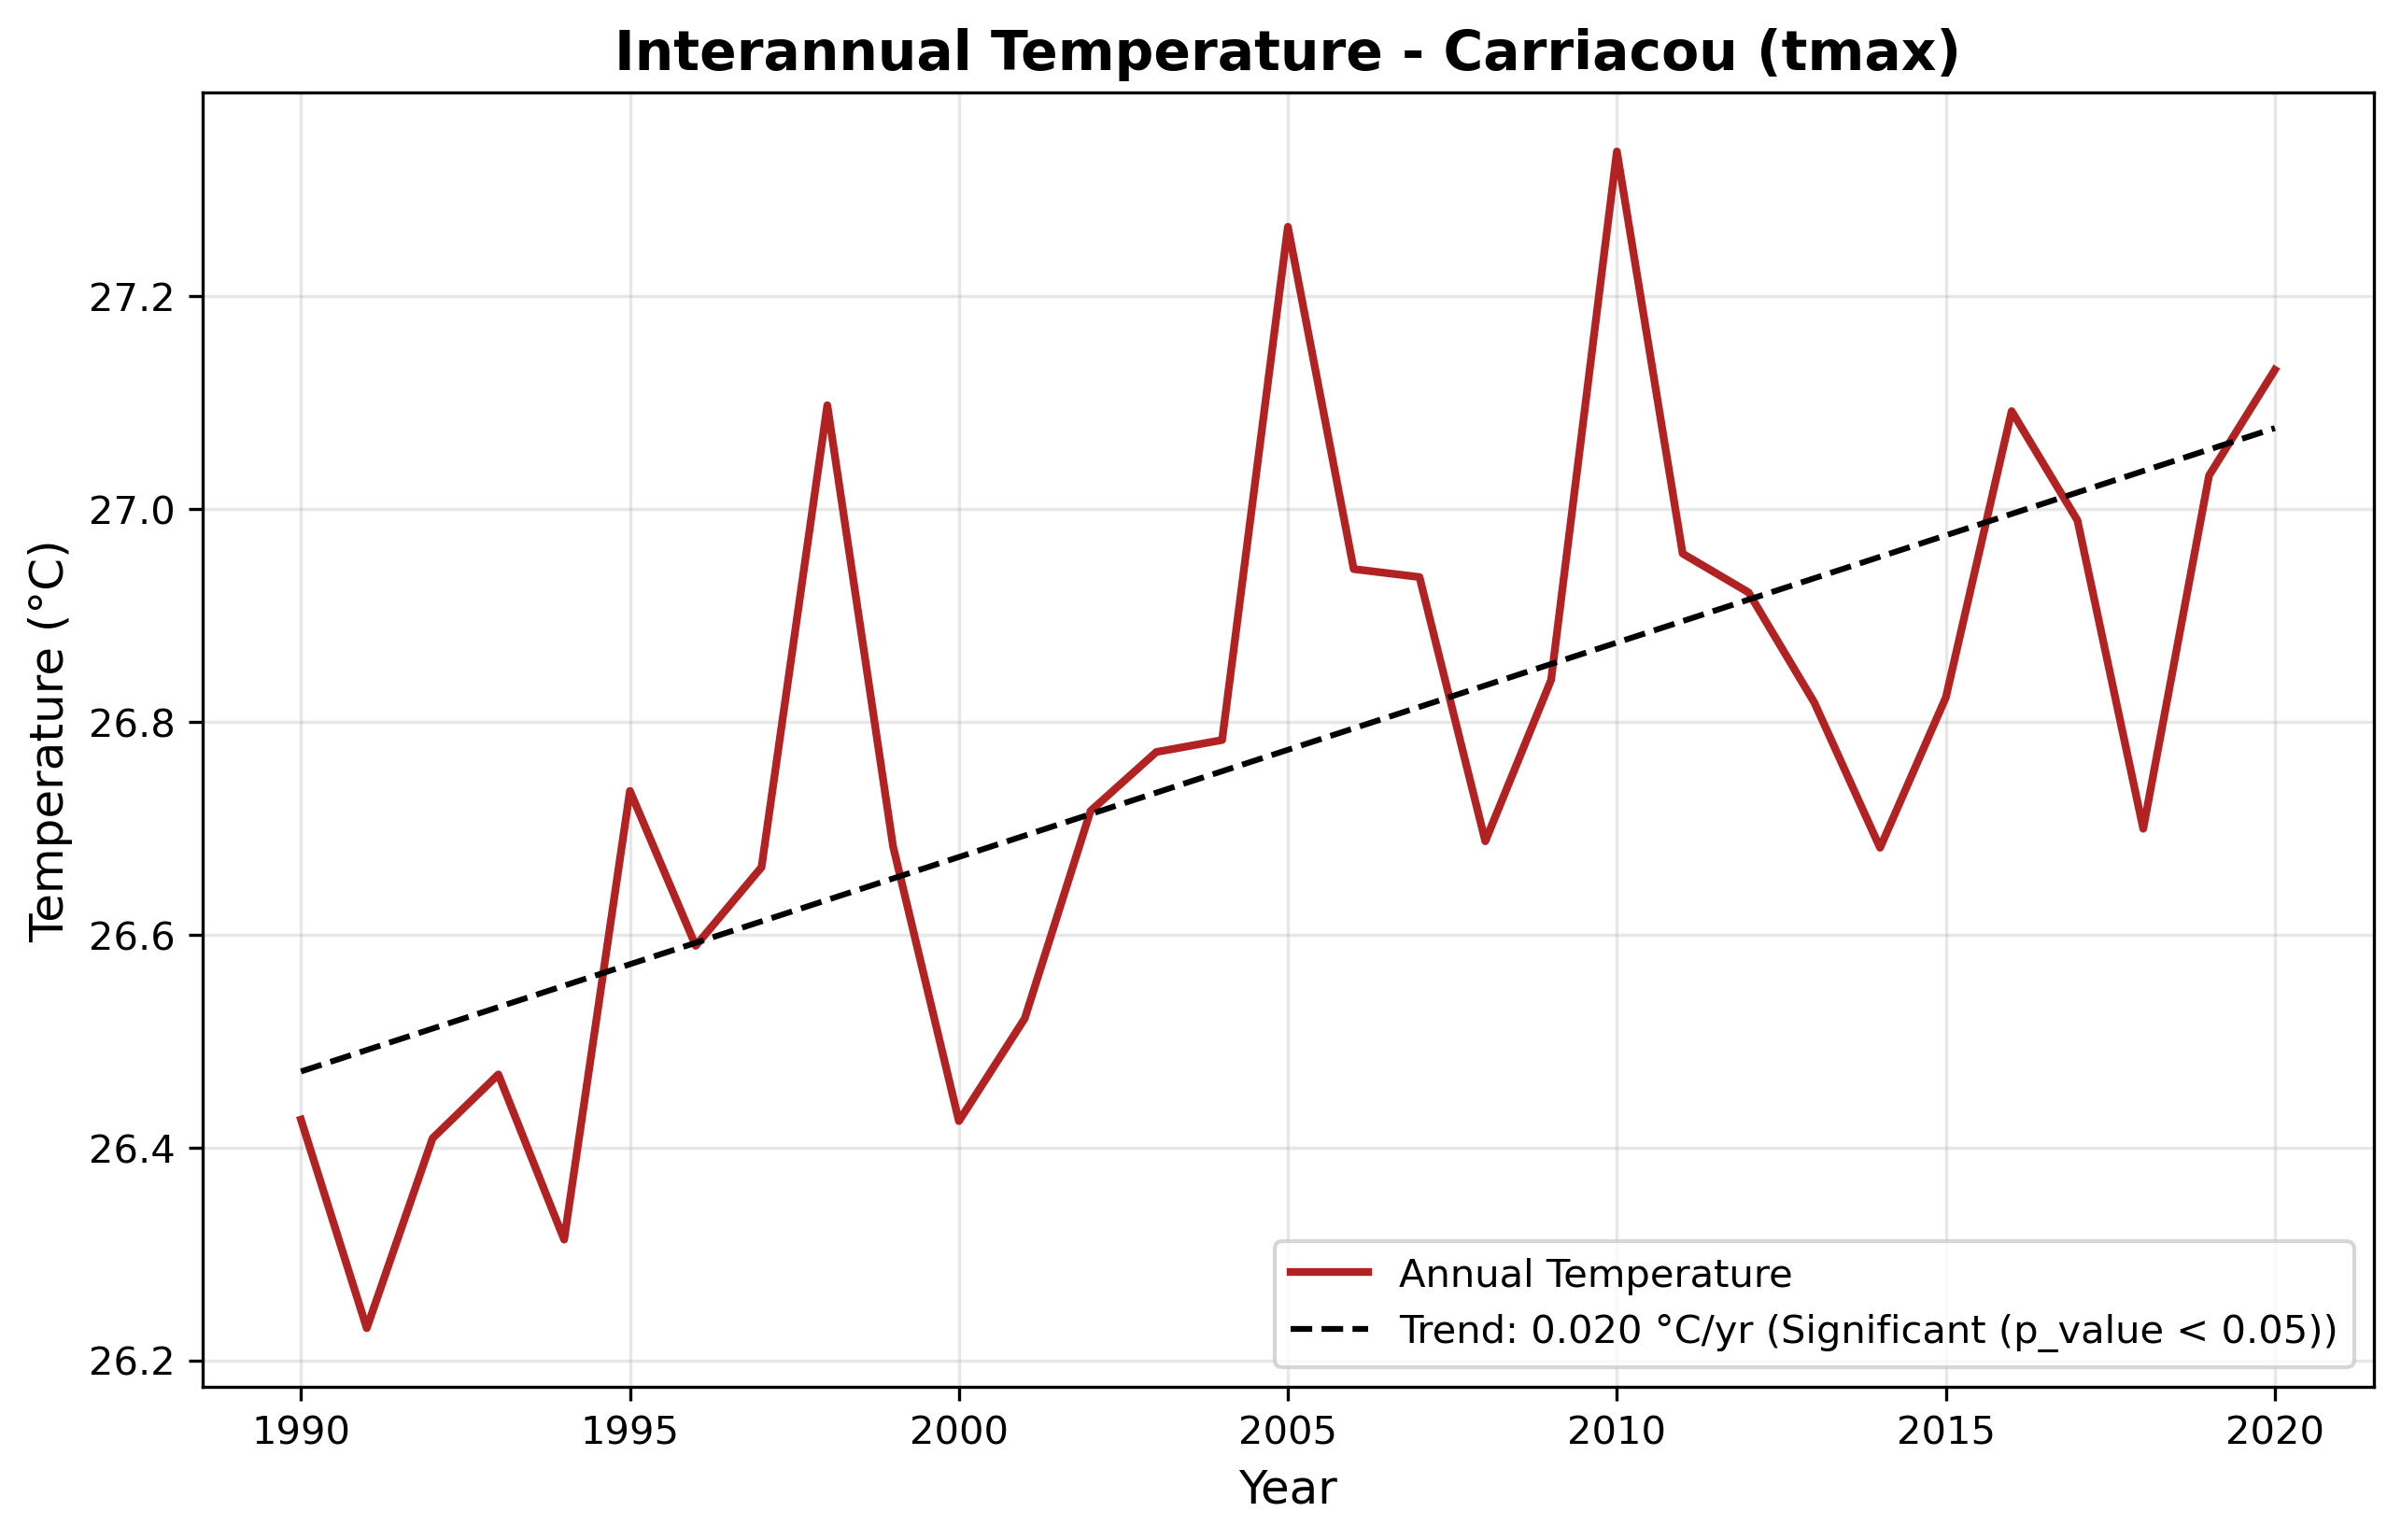
Interannual temperature analysis examines year-to-year variations in mean, minimum, and maximum temperatures, allowing for the identification of long-term trends and climate variability. ERA5 data was processed by extracting annual averages for each temperature variable, with values aggregated at the parish level. This dataset enables the detection of warming or cooling trends over time, the evaluation of extreme temperature events, and the assessment of potential shifts in climate patterns.

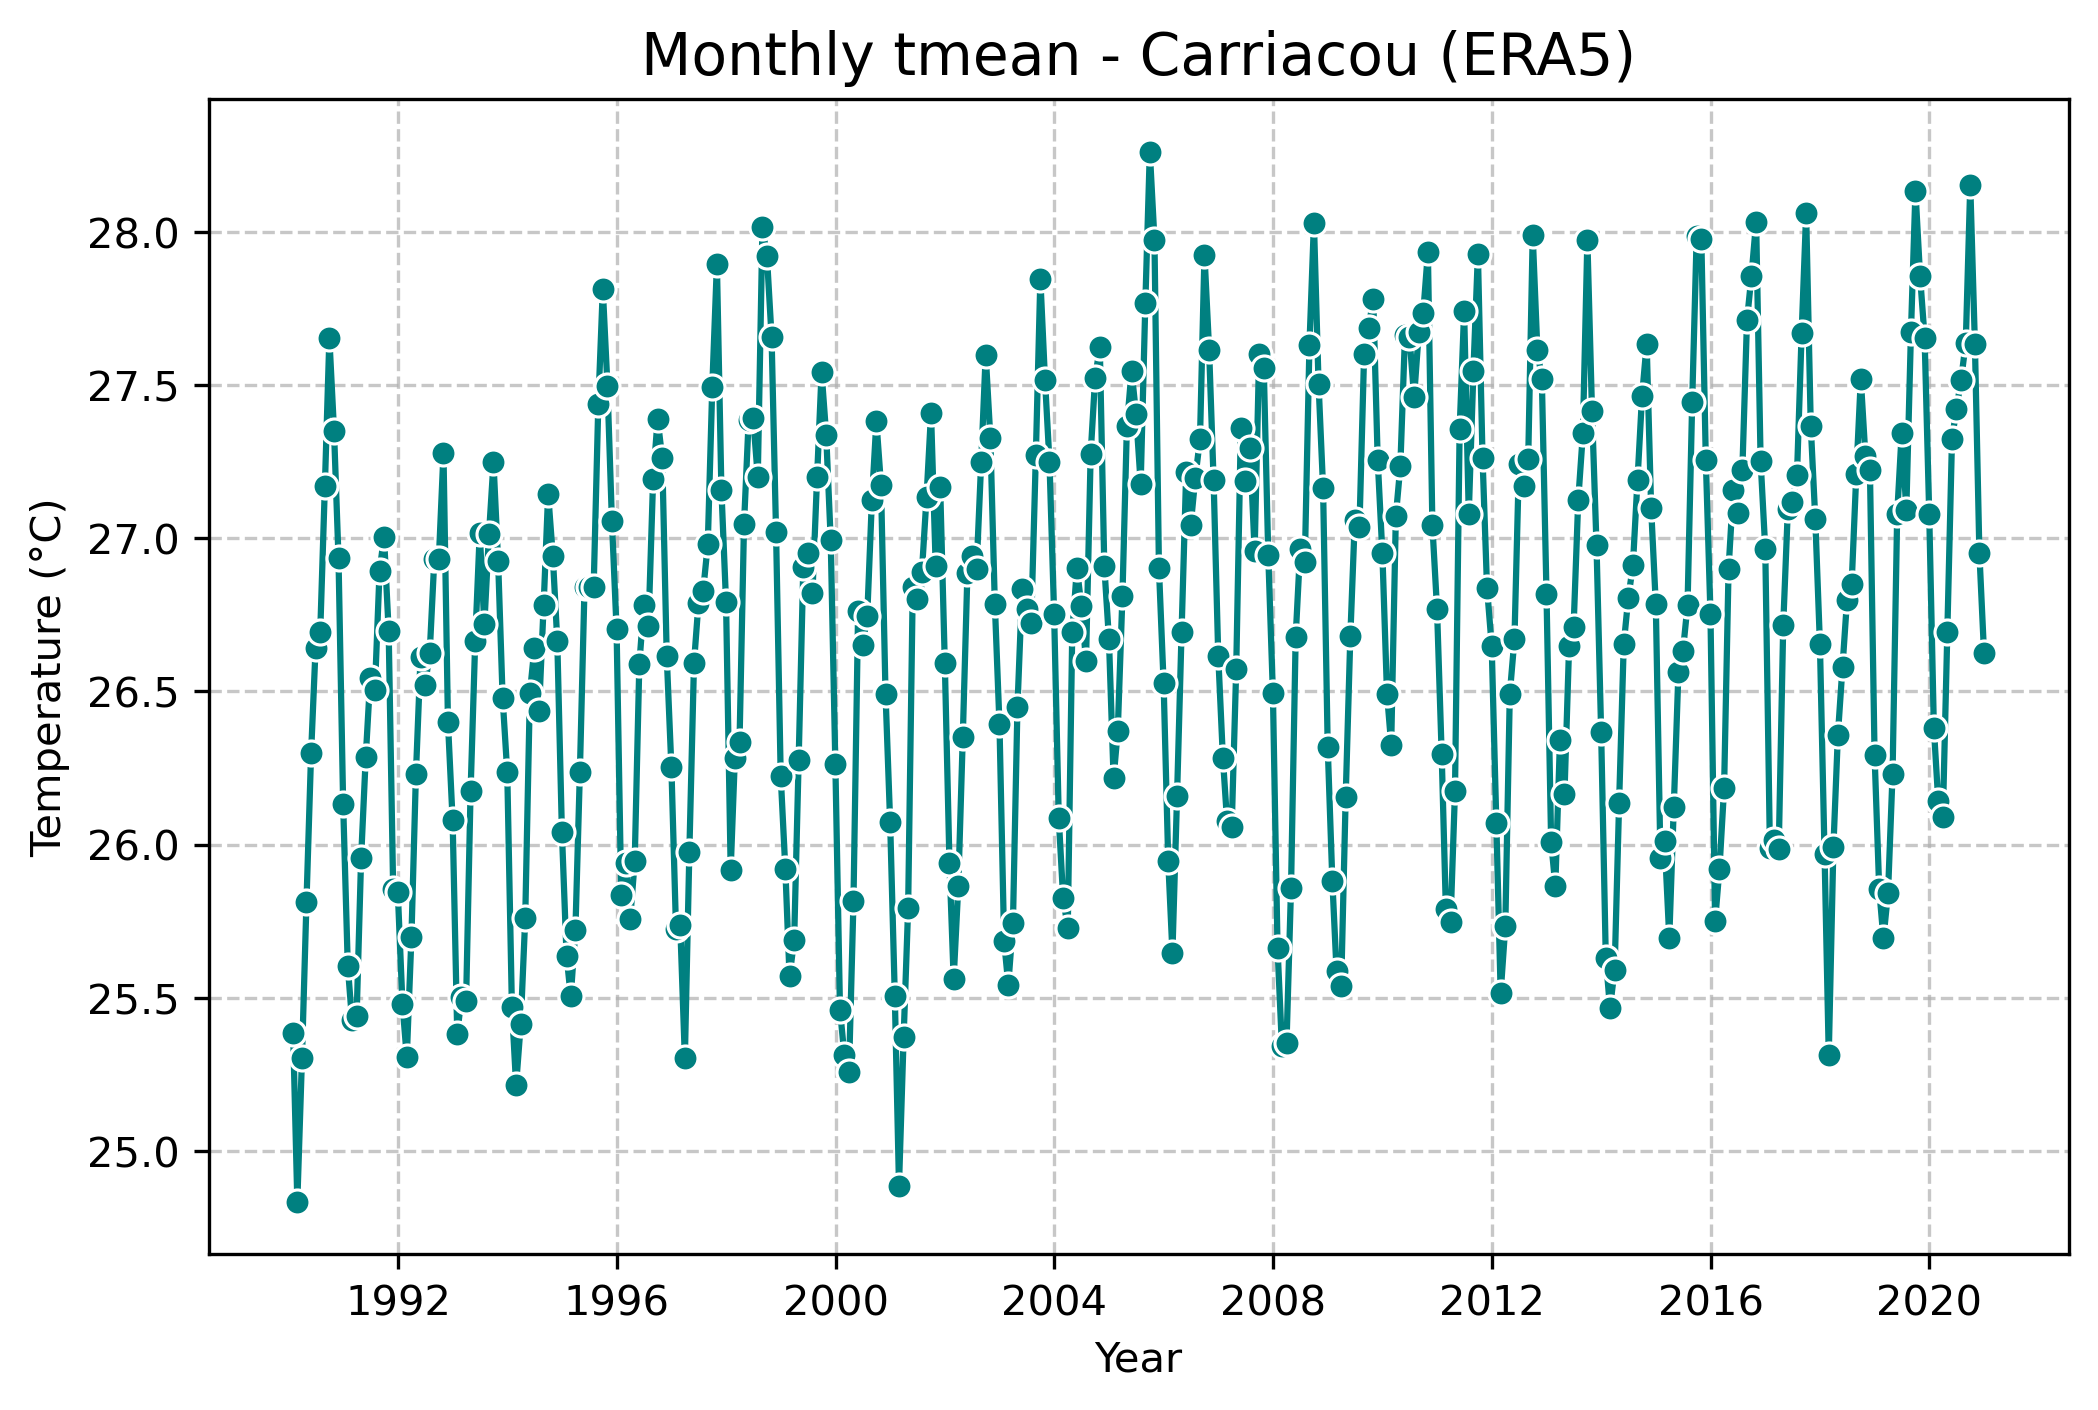
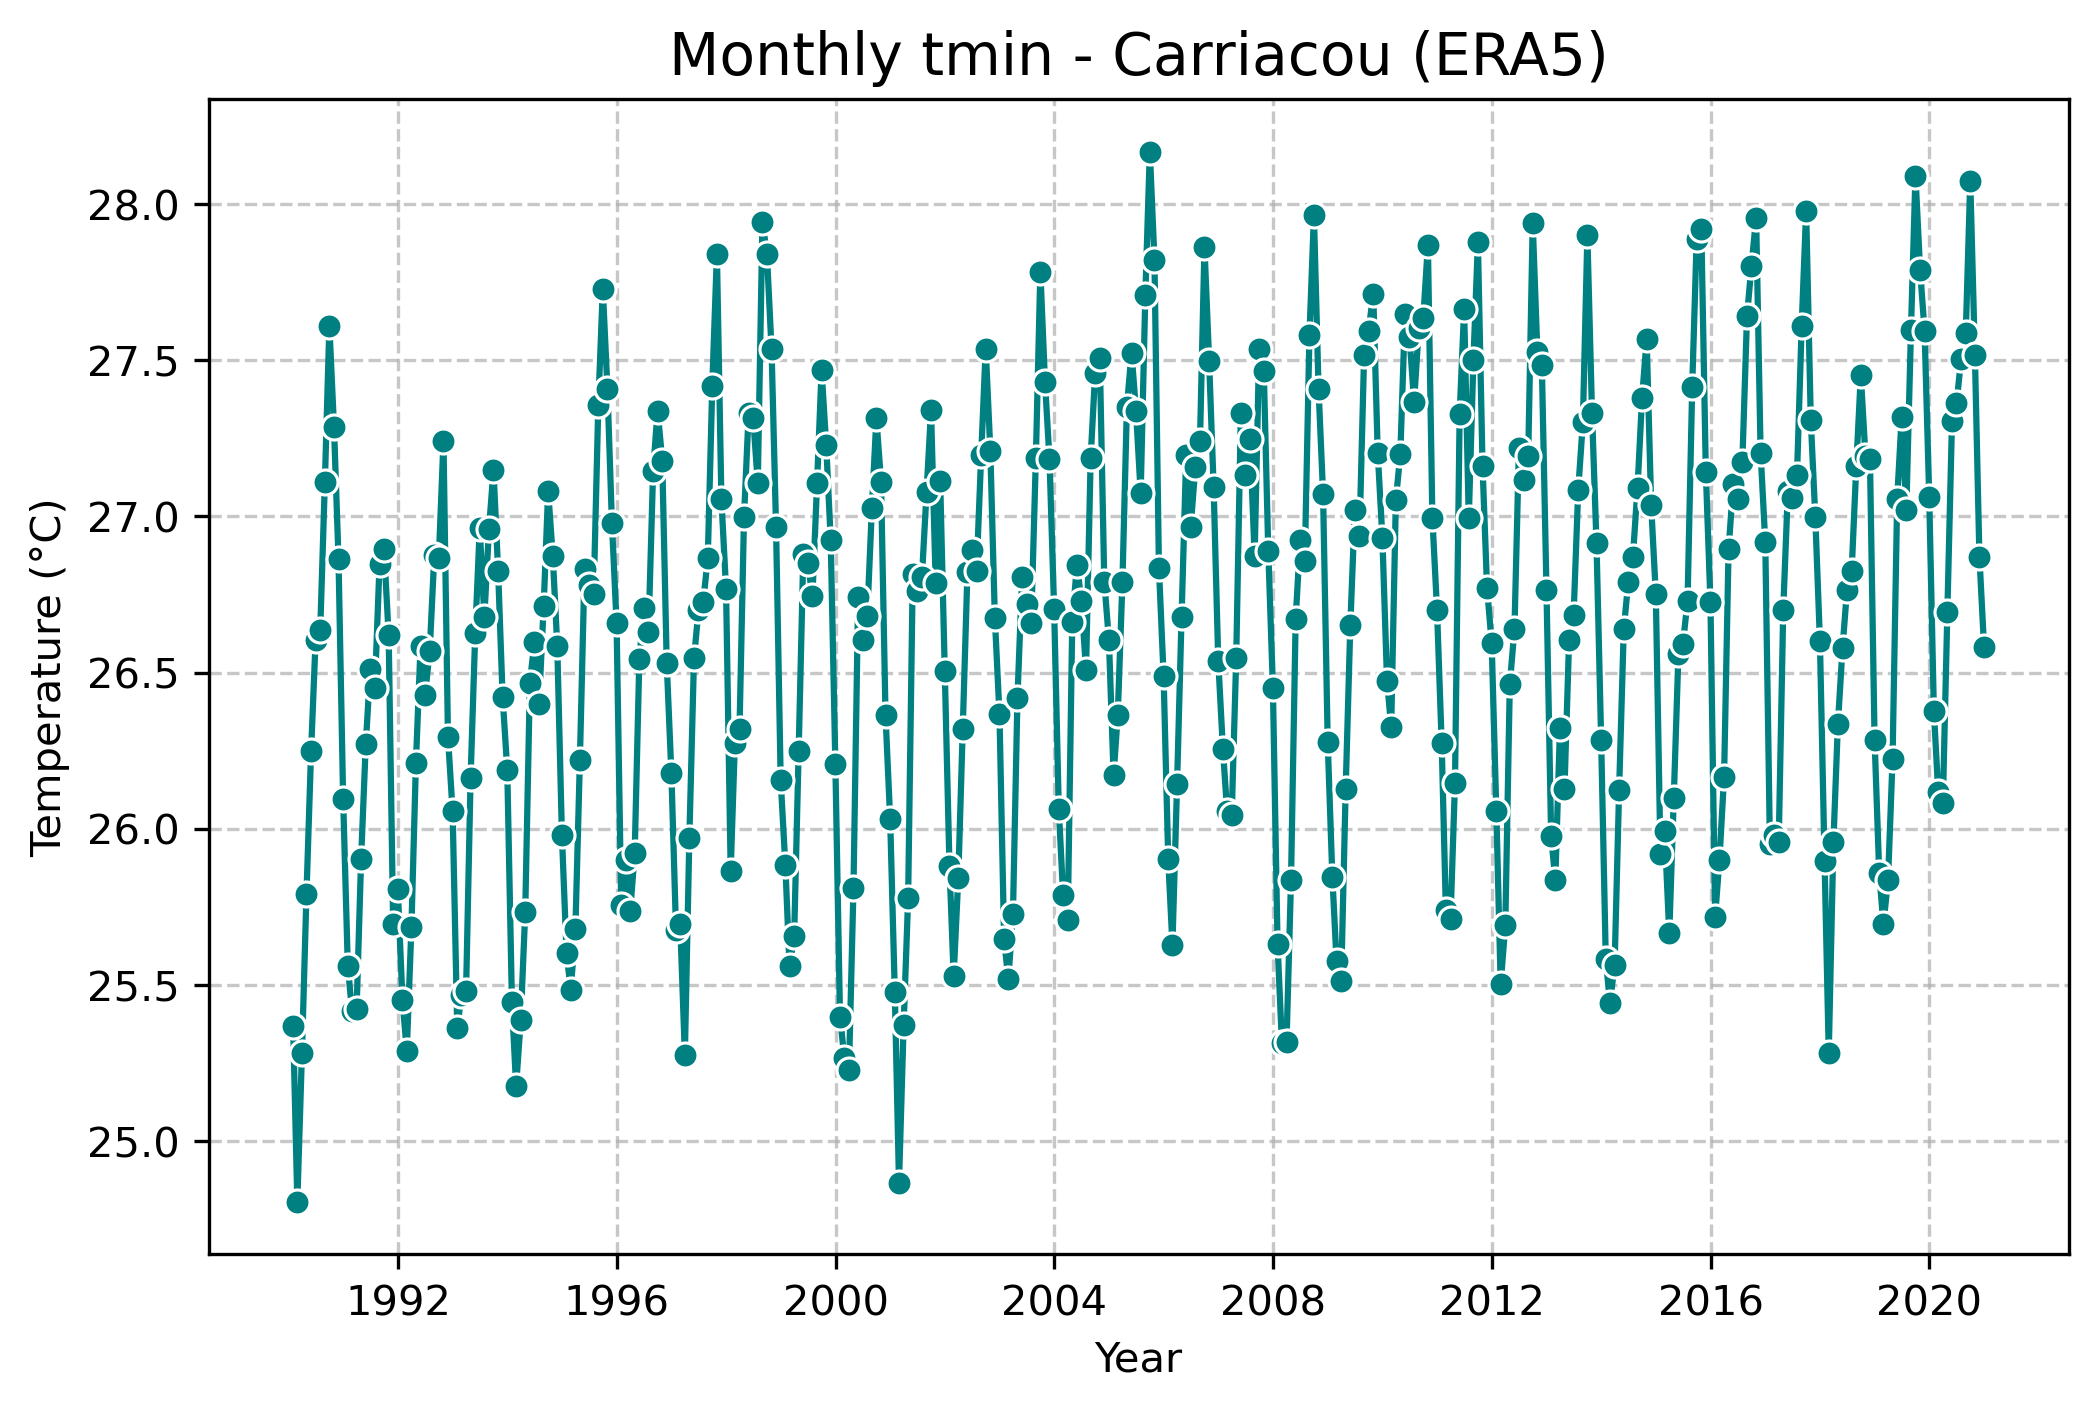
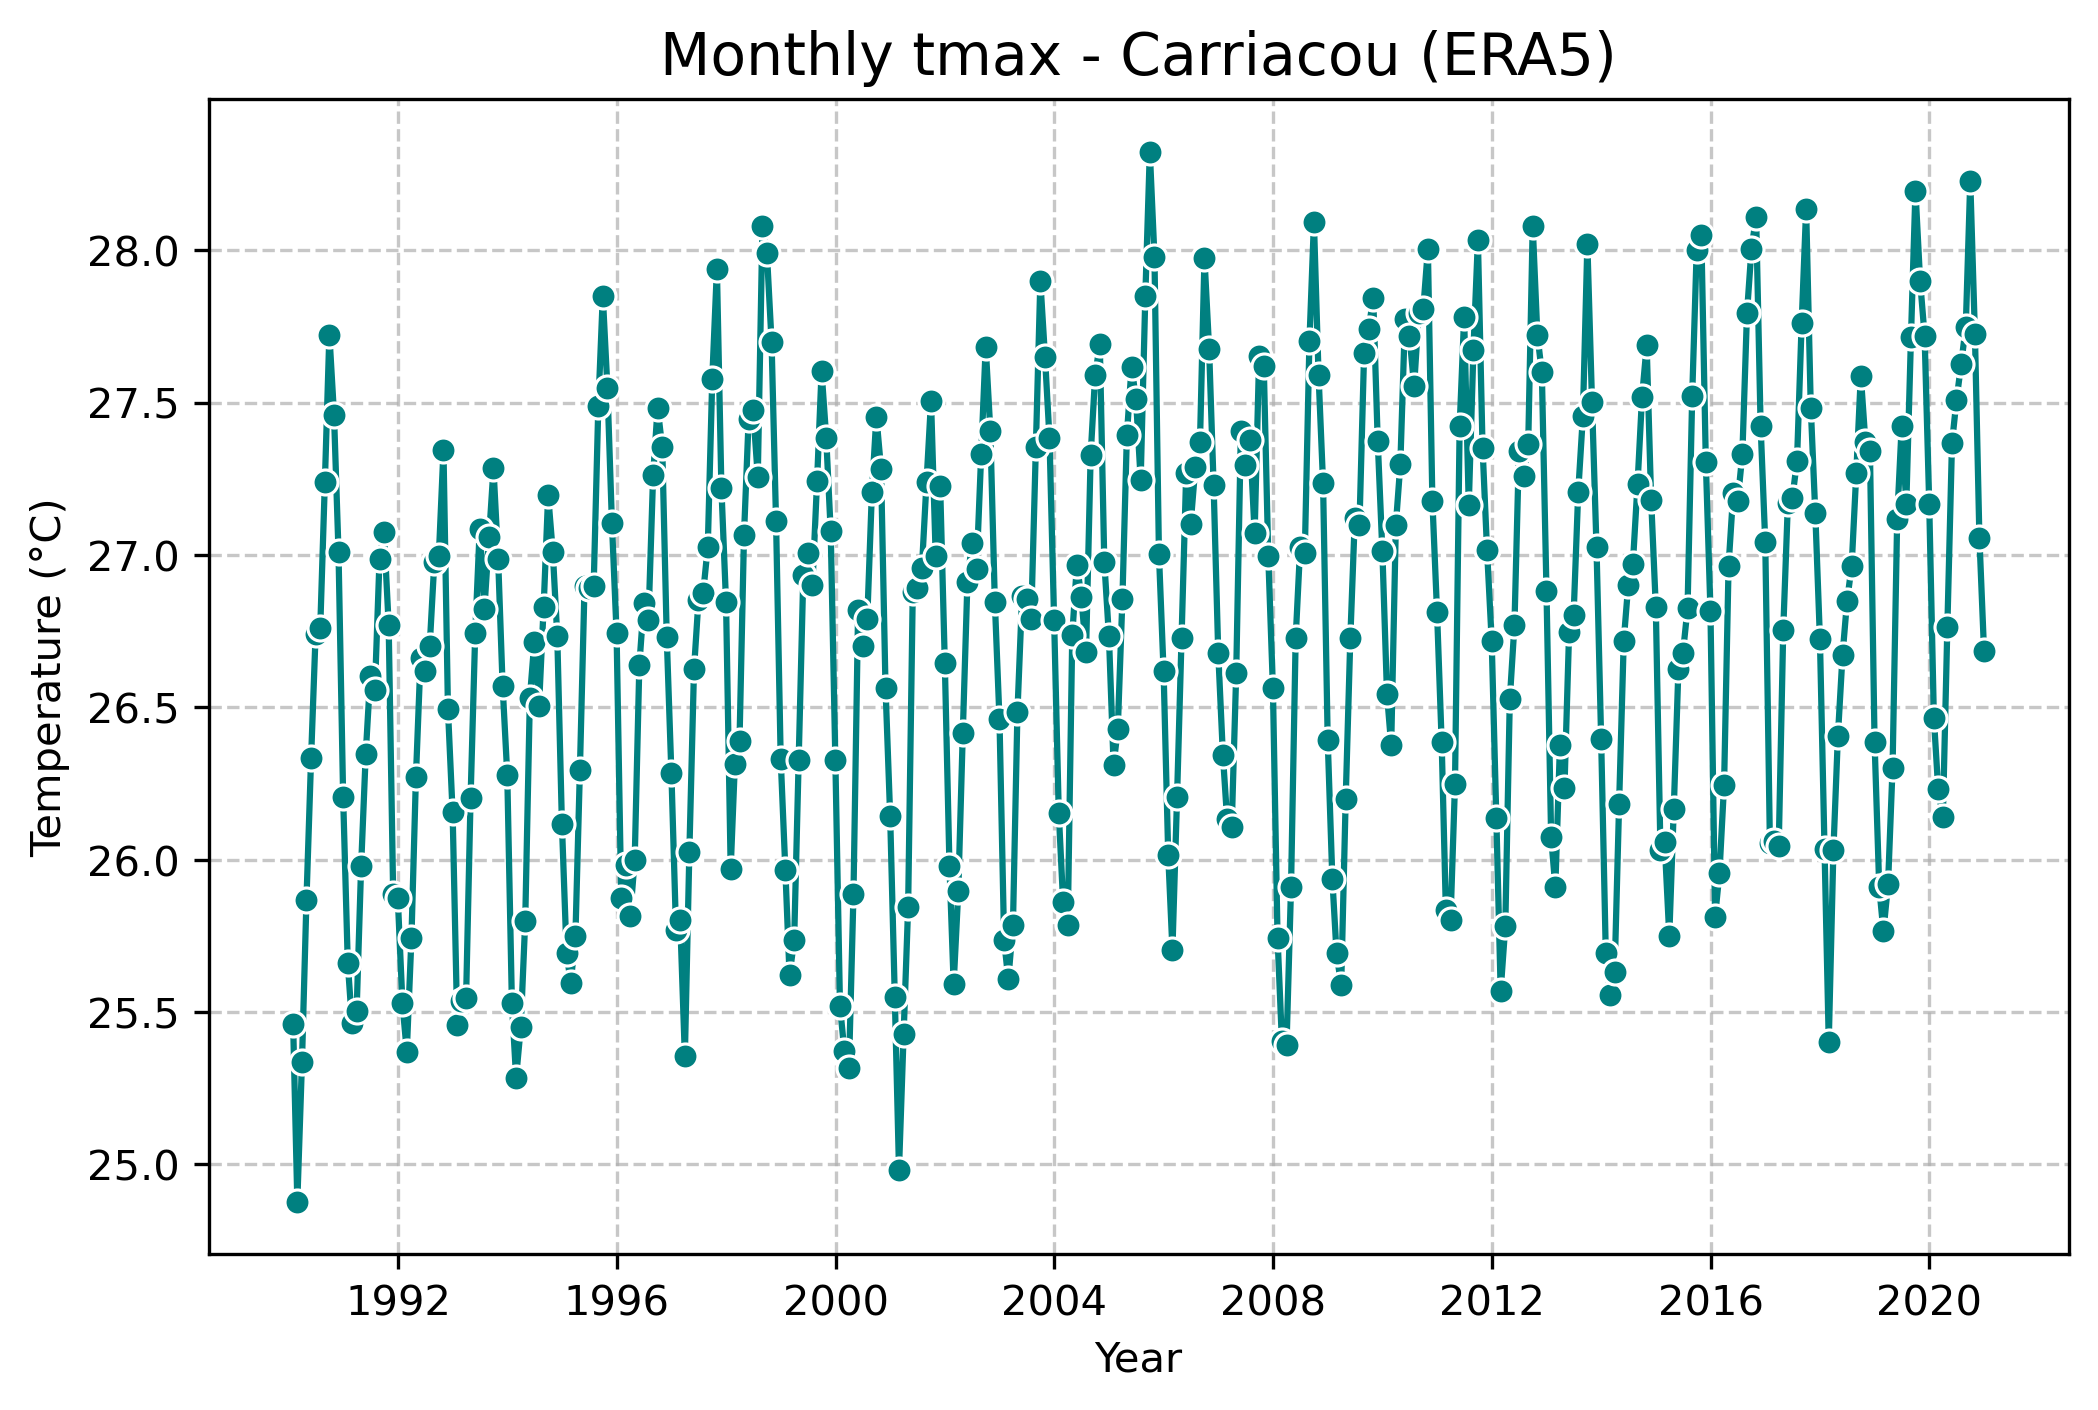
Monthly temperature analysis focuses on capturing the variability of mean, minimum, and maximum temperatures for each month, highlighting short-term fluctuations and seasonal dynamics. ERA5 temperature data was extracted and aggregated at the parish level, ensuring spatial consistency. Monthly values were computed to track temperature variations across different times of the year, identifying unusually warm or cold months. This analysis is particularly useful for monitoring heatwaves, cold spells, and other temperature-related hazards that may affect agriculture, infrastructure, and public health.

The State of Grenada consists of three islands- Grenada, Carriacou and Petite Martinique which form the southern end of the Windward Islands.
Phone +1 (473) 440-2255