Climate Projections

2030 | GRENADA

Access detailed climate projections and understand
how these changes affect food security and discover
recommendations for climate resilience.

Mean Annual
Precipitation - 2030

Download Data
+

The climatology of precipitation was computed to capture long-term spatial patterns of average precipitation across different future time periods (2030, 2050, and 2070).

Climatology - 2030

Download Data
+

By averaging precipitation values over these multi-decade periods, we assessed potential shifts in baseline precipitation conditions. The ensemble mean was used to ensure robust projections, minimizing the influence of individual model biases. These results highlight regions of projected increases or decreases in precipitation, providing insight into long-term hydrological trends and potential water availability challenges in the future.

St. Andrew - 2030

St. David - 2030

St. George - 2030

St. John - 2030

St. Mark - 2030

St. Patrick - 2030

Interannual
Precipitation - 2030

Download Data
+

To examine how precipitation fluctuates from year to year, we analyzed interannual precipitation variability across the climate model ensemble. This assessment helps identify potential trends in wet and dry years, capturing long-term shifts in variability that could impact drought frequency and intensity.

St. Andrew - 2030

St. David - 2030

St. George - 2030

St. John - 2030

St. Mark - 2030

St. Patrick - 2030

Monthly
Precipitation - 2030

Download Data
+

Monthly precipitation patterns were evaluated to assess potential changes in seasonality and shifts in rainfall distribution throughout the year. The analysis of monthly precipitation allows  to detect alterations in the timing and magnitude of wet and dry seasons, which is critical for understanding impacts on agriculture, water resources, and ecosystem functioning.

St. Andrew - 2030

St. David - 2030

St. George - 2030

St. John - 2030

St. Mark - 2030

St. Patrick - 2030

Standardized Precipitation Index
(SPI 3-Month) - 2030

Download Data
+

To assess future drought conditions, the Standardized Precipitation Index (SPI) is presented at two different timescales:

SPI3 - 2030

SPI12 - 2030

Standardized Precipitation Index Interannual (SPI 3-Month) - 2030

Download Data
+

SPI3 (3-month precipitation anomalies) for short-term drought impacts and SPI12 (12-month precipitation anomalies) for long-term hydrological drought assessment. These indices help evaluate potential shifts in drought frequency, severity, and duration under future climate conditions.

St. Andrew - 2030

St. David - 2030

St. George - 2030

St. John - 2030

St. Mark - 2030

St. Patrick - 2030

Minimum, Maximum and Mean Temperature - 2030

Download Data
+

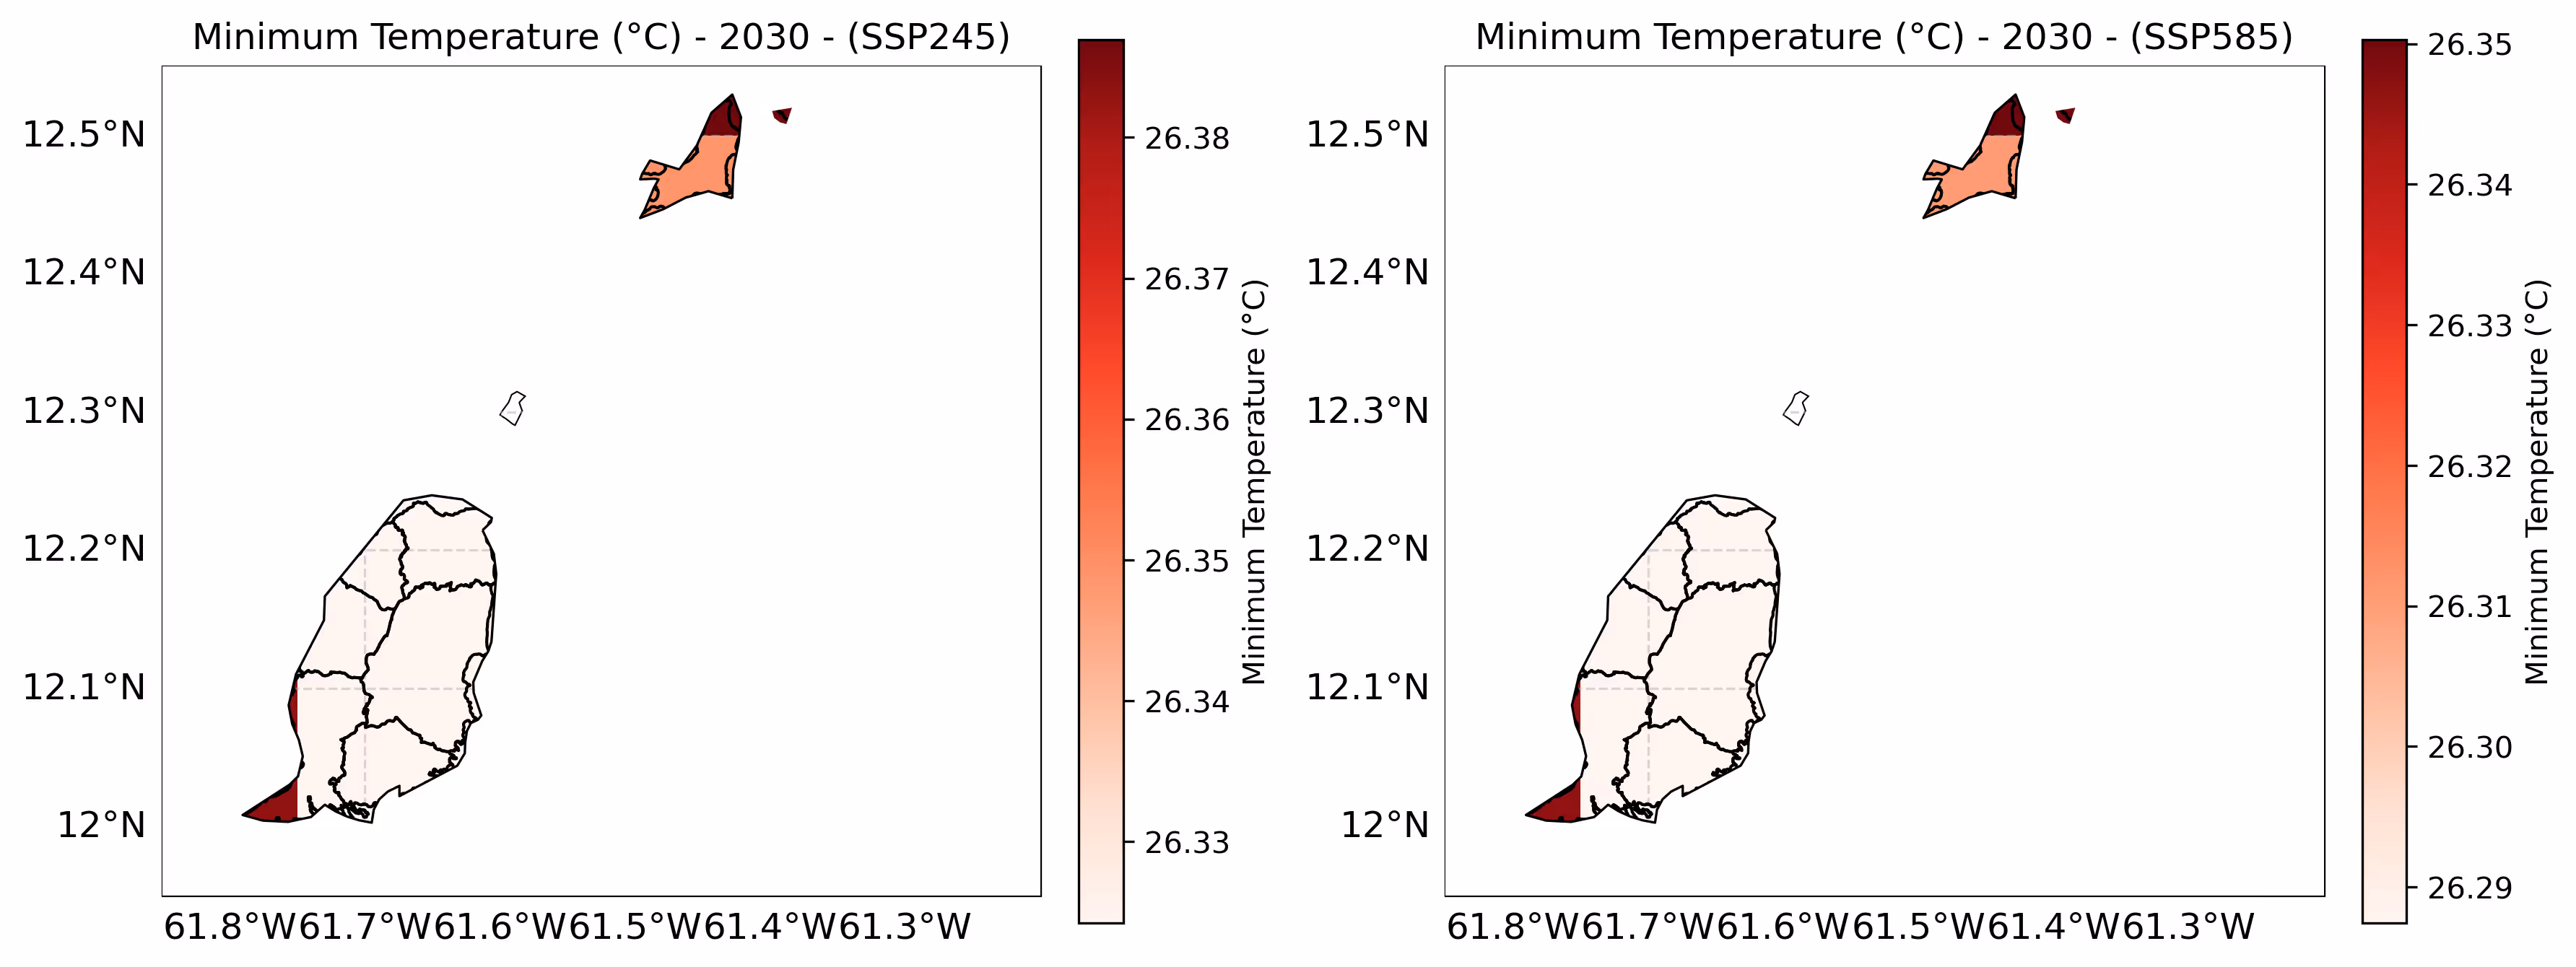
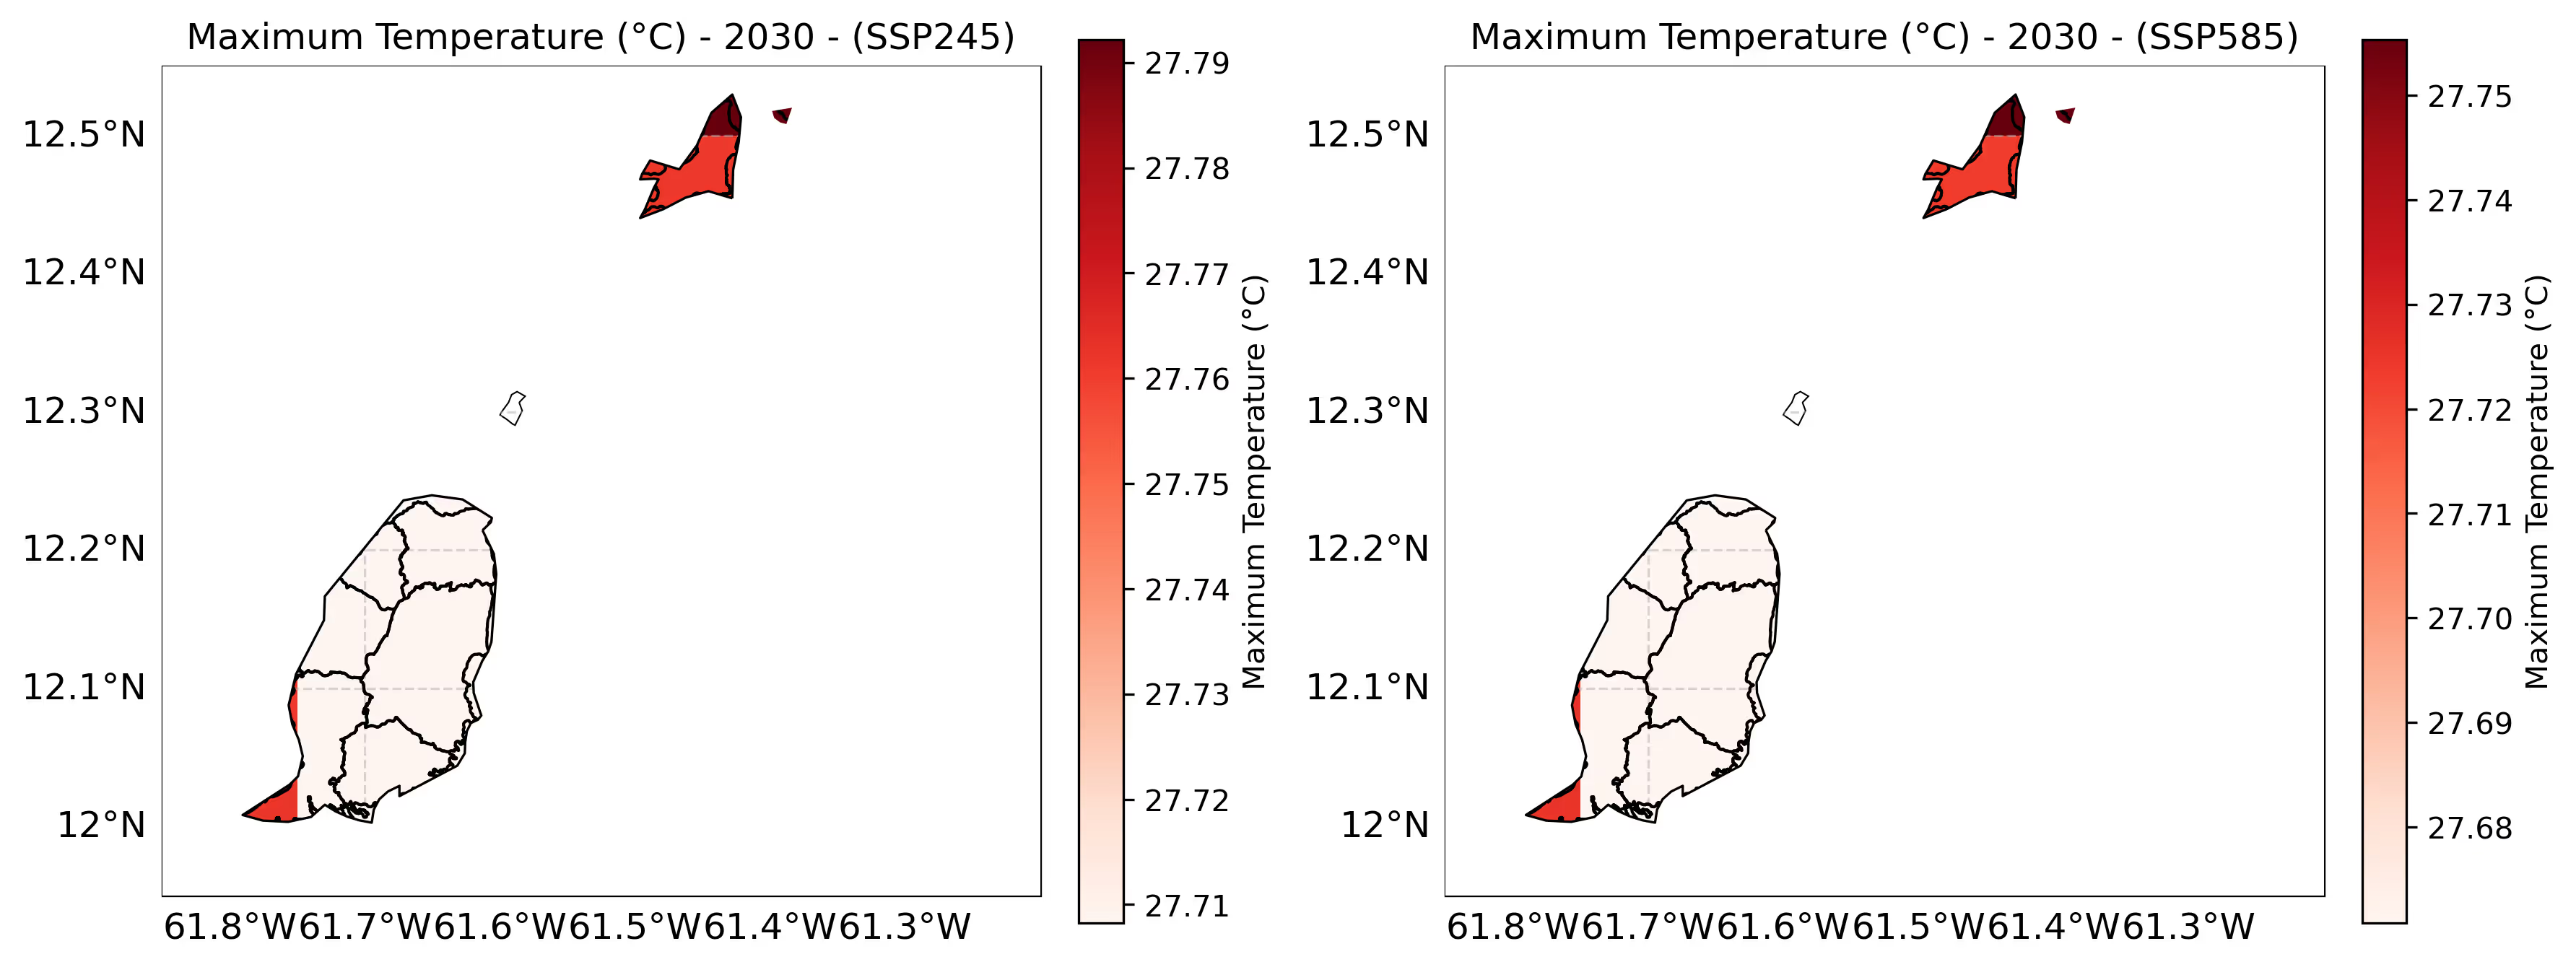
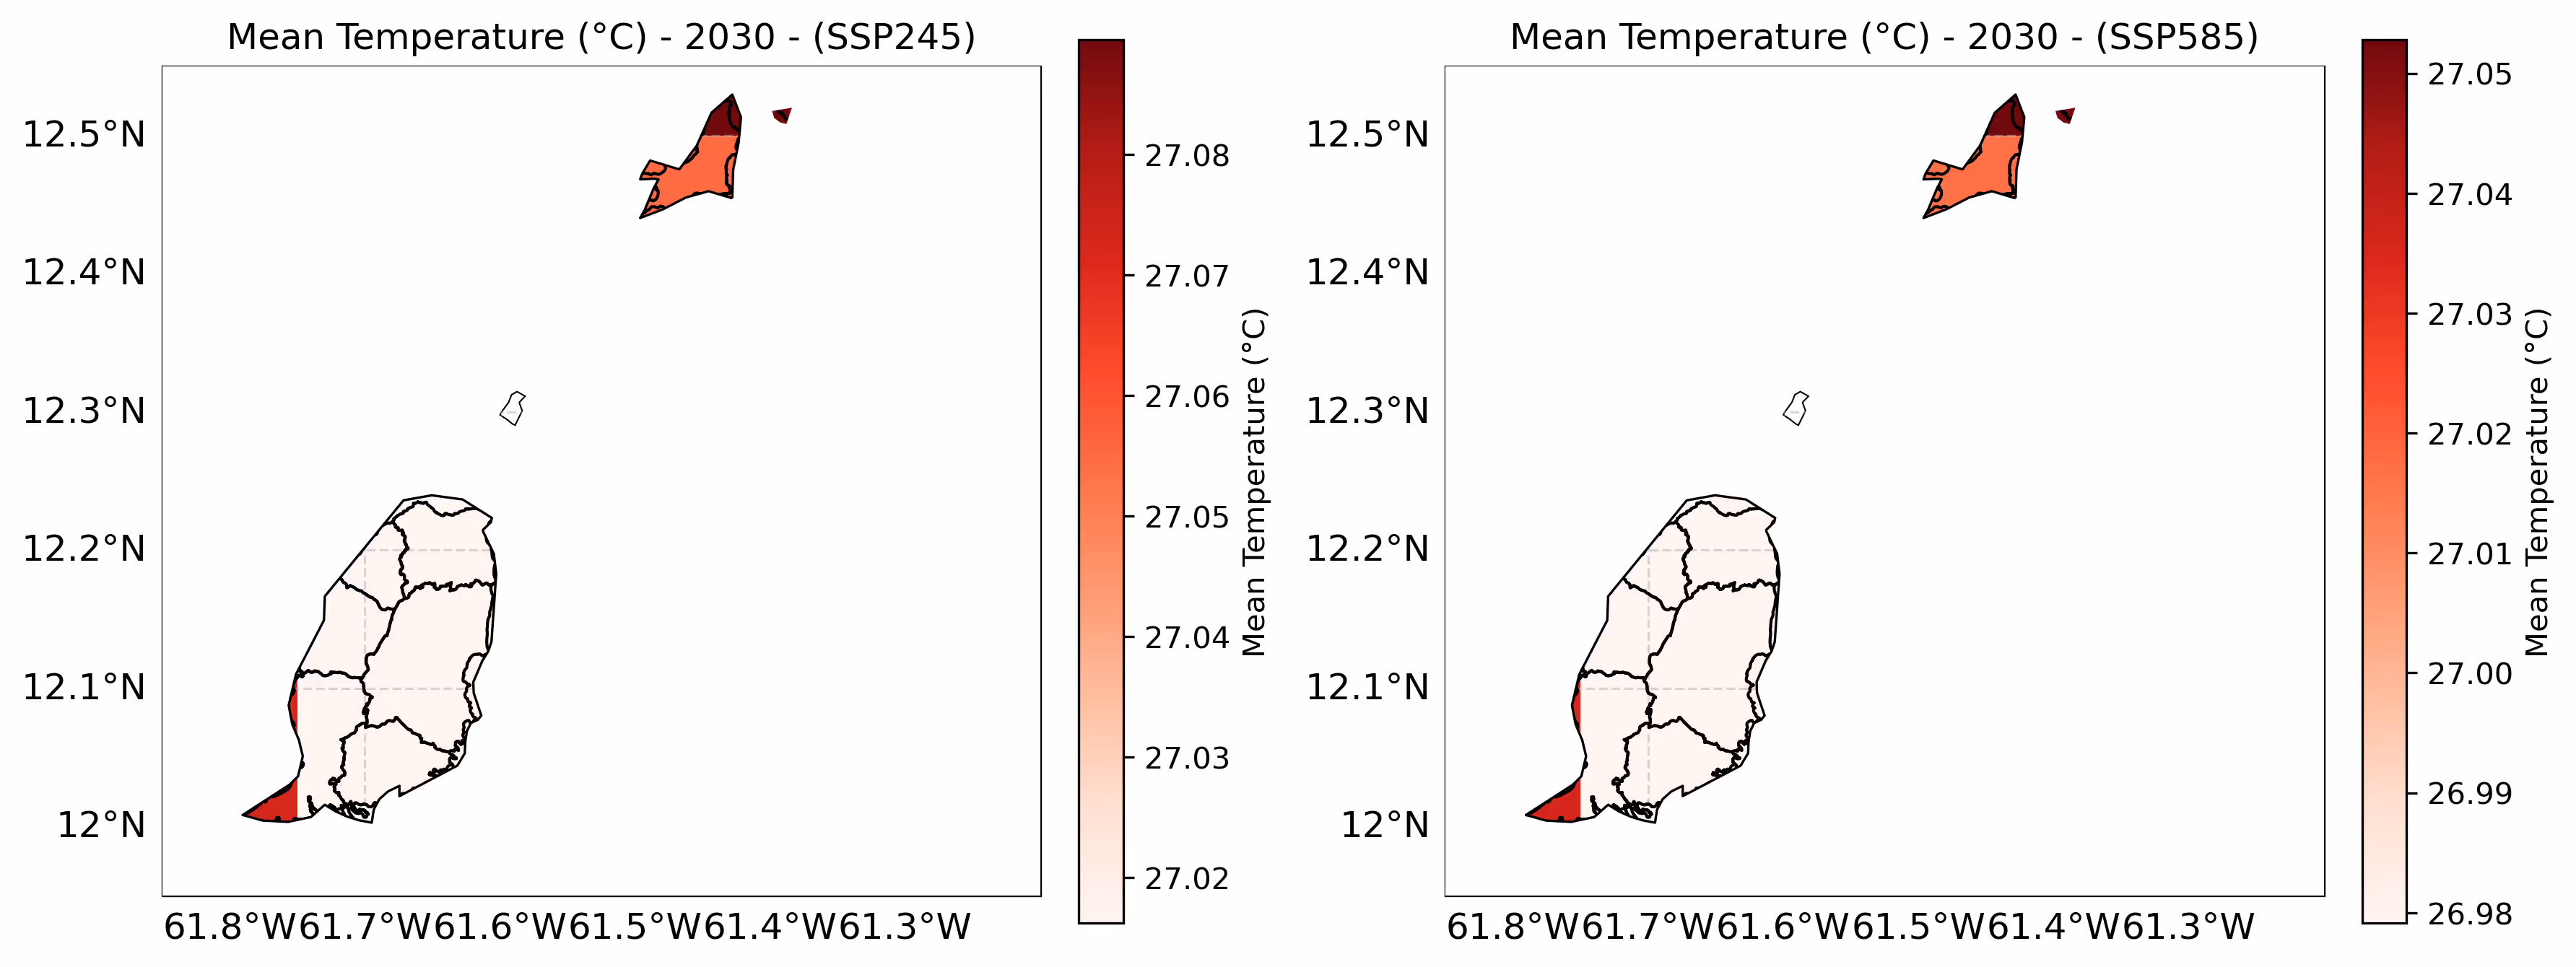
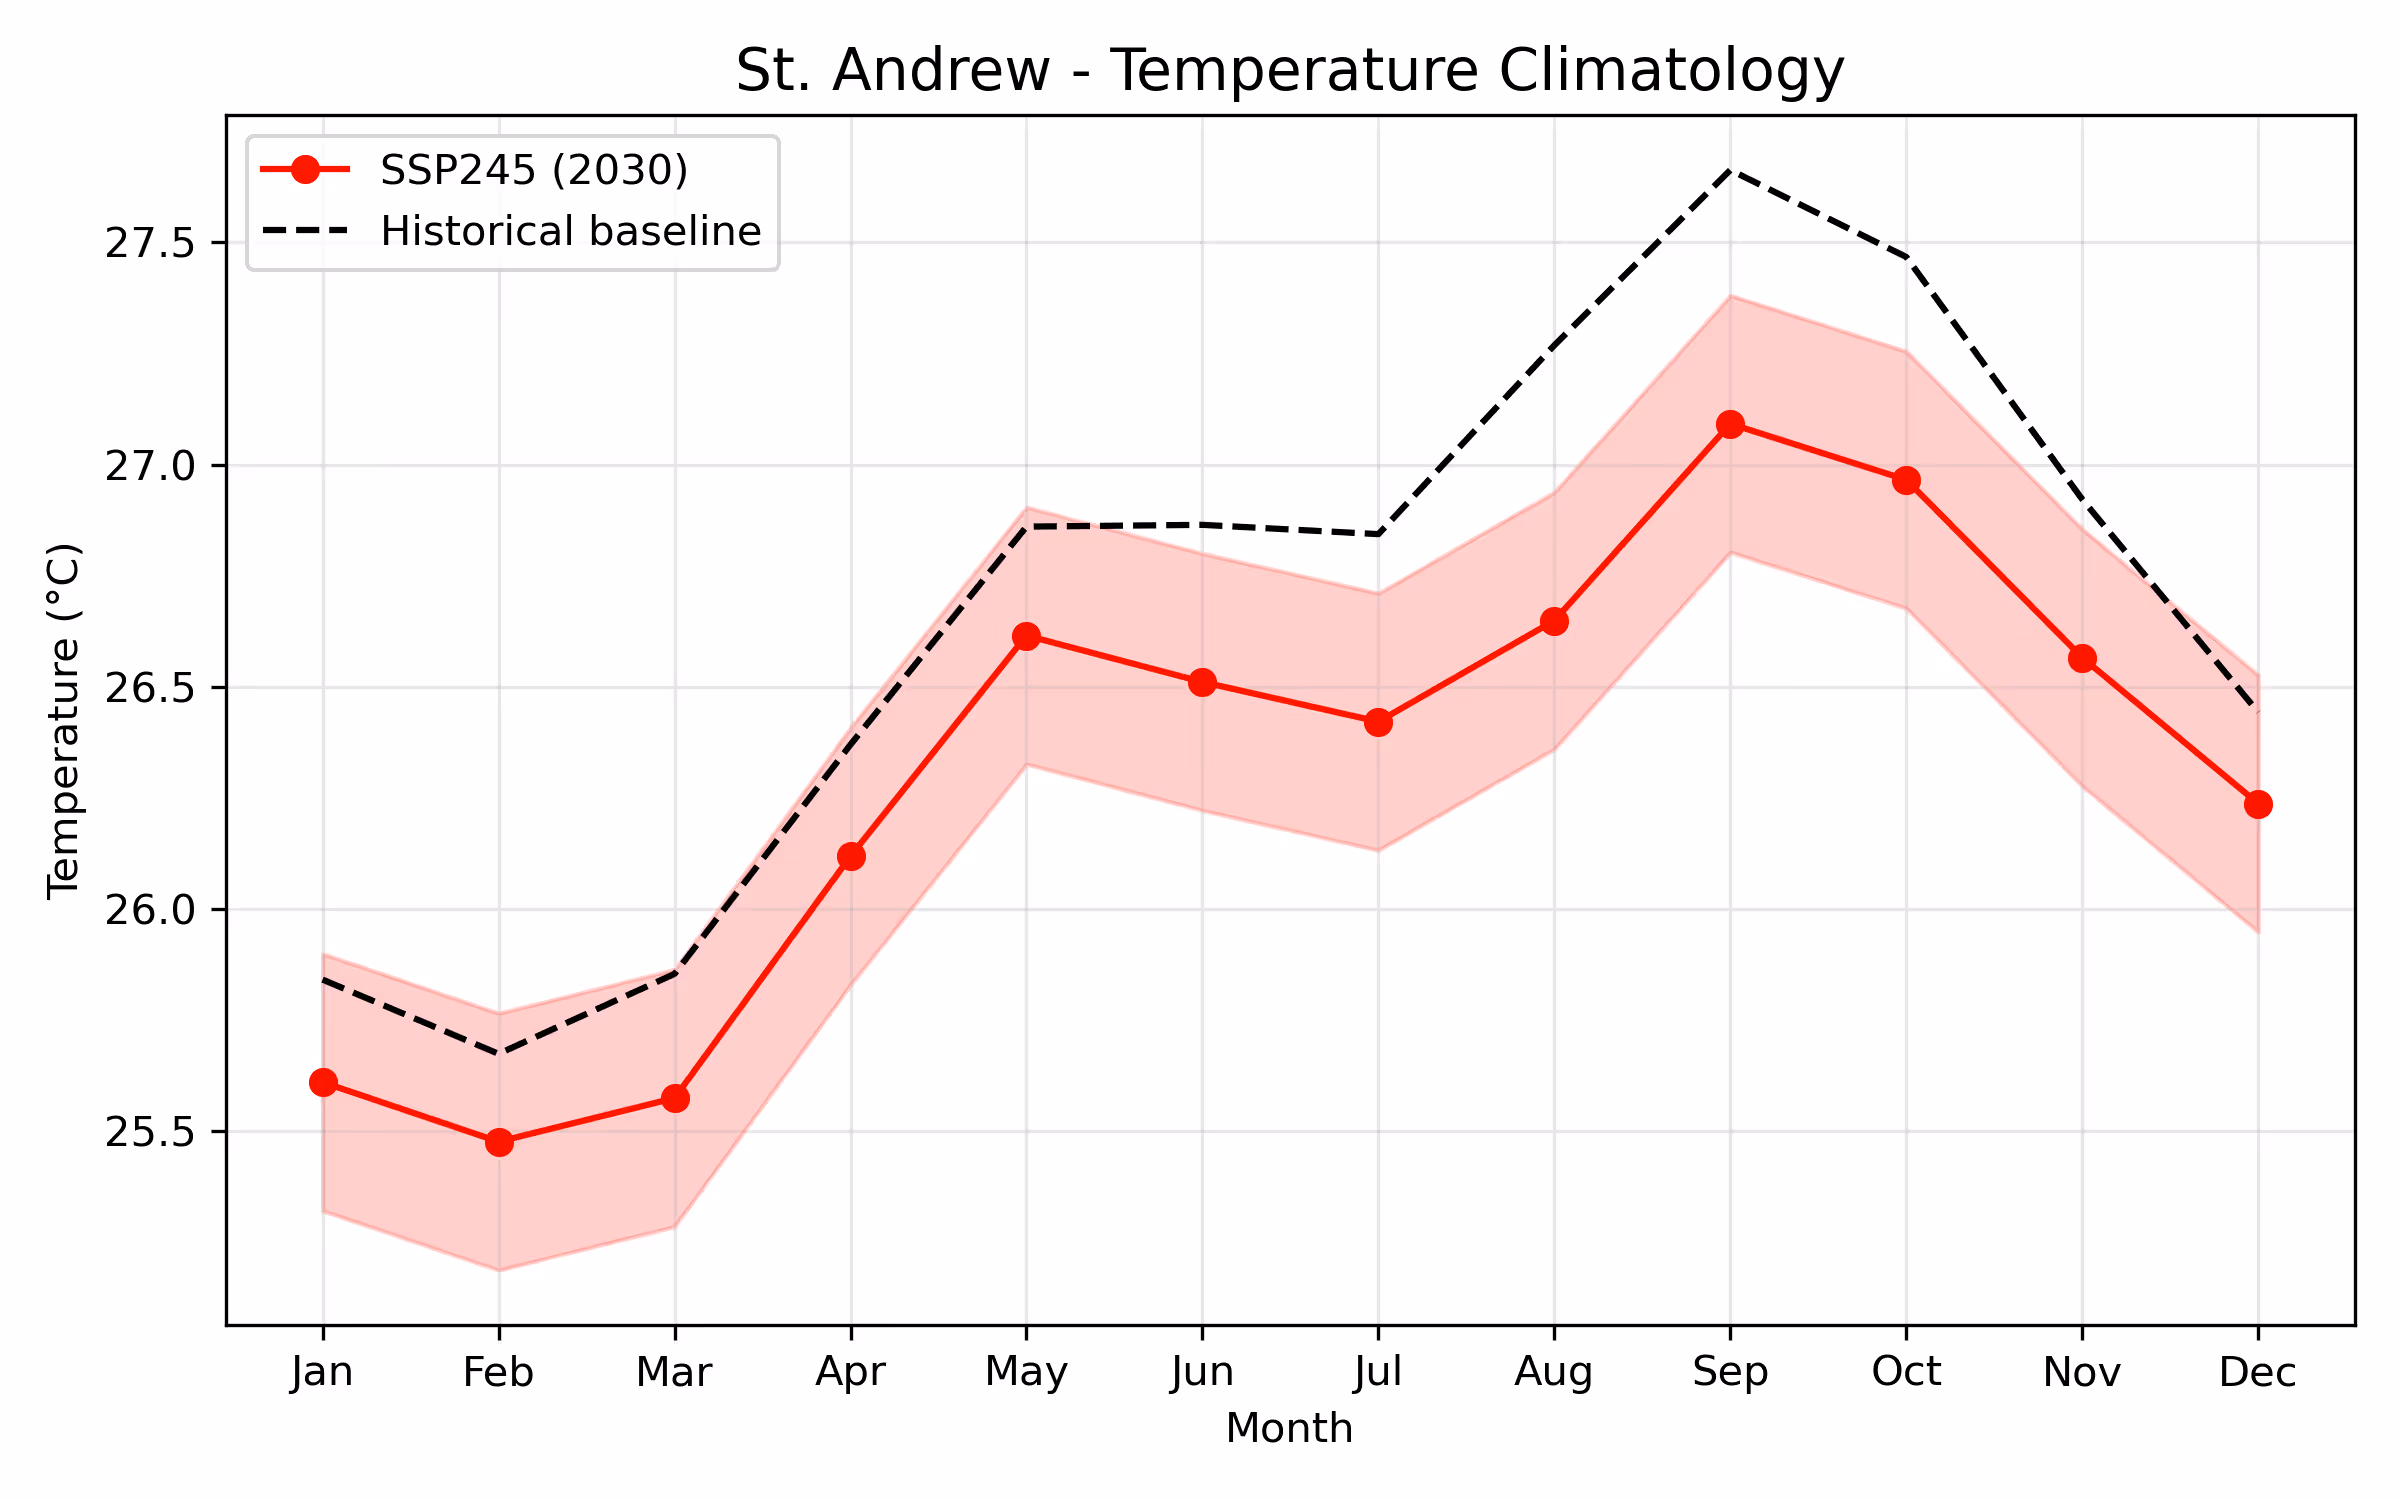
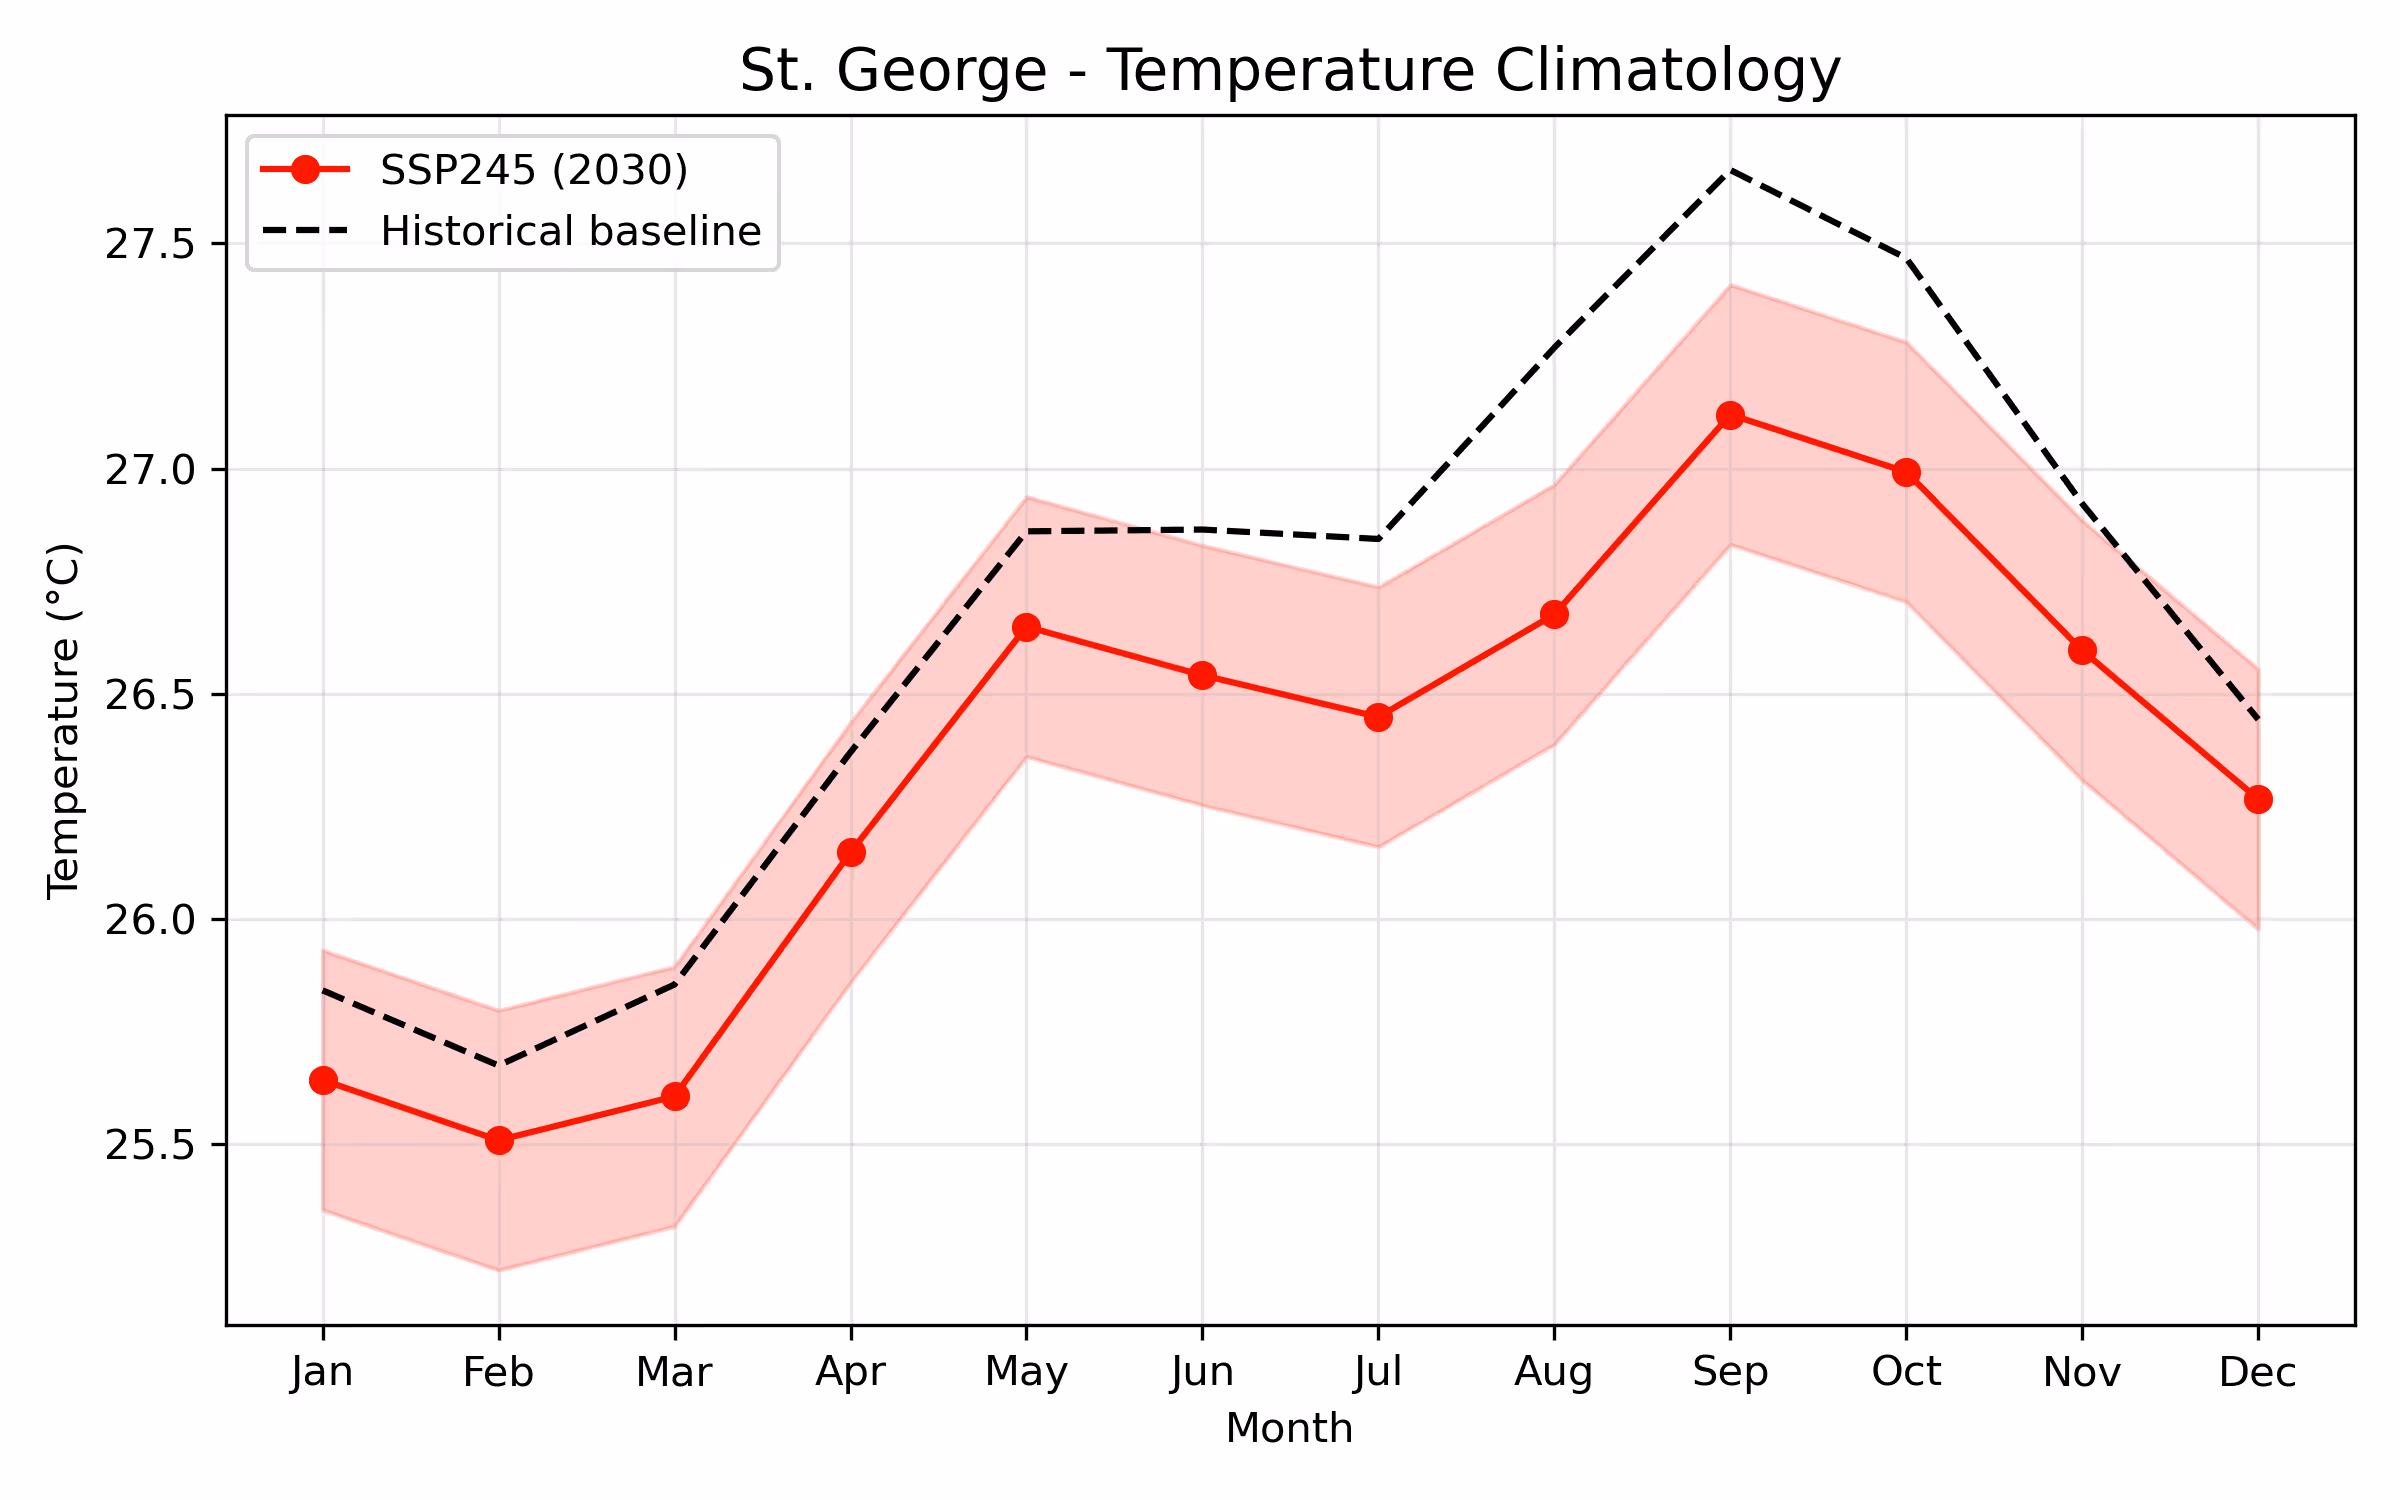
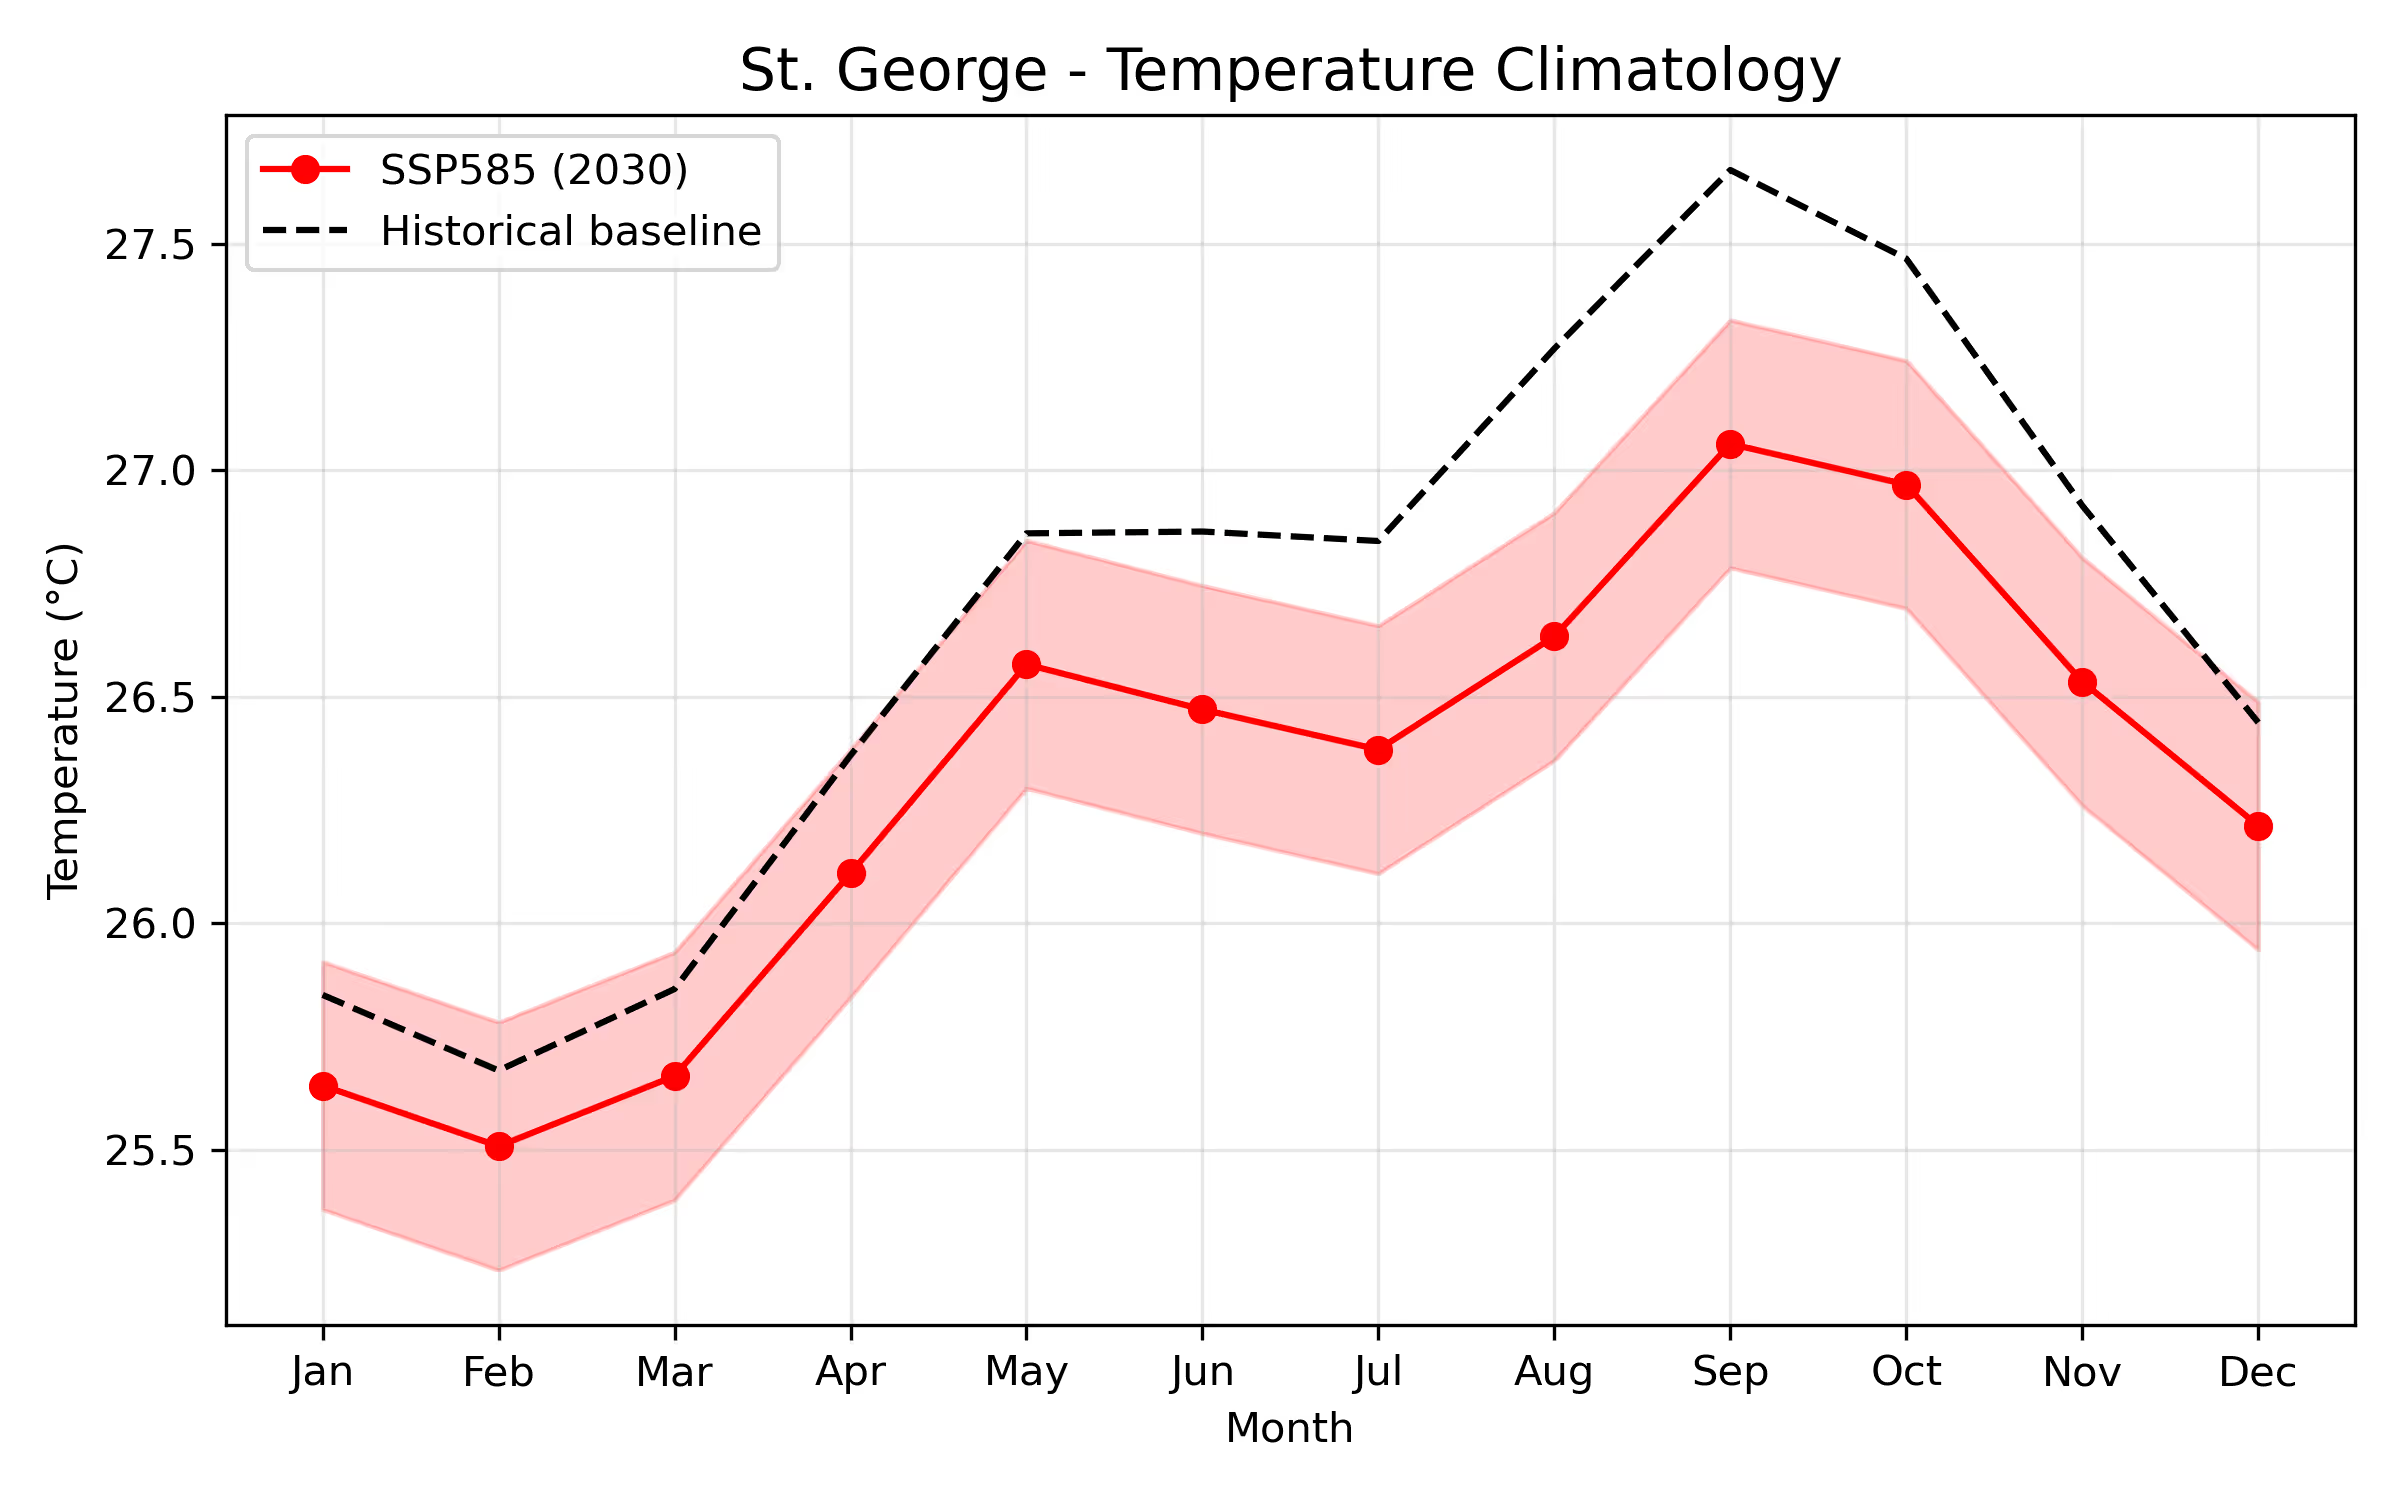
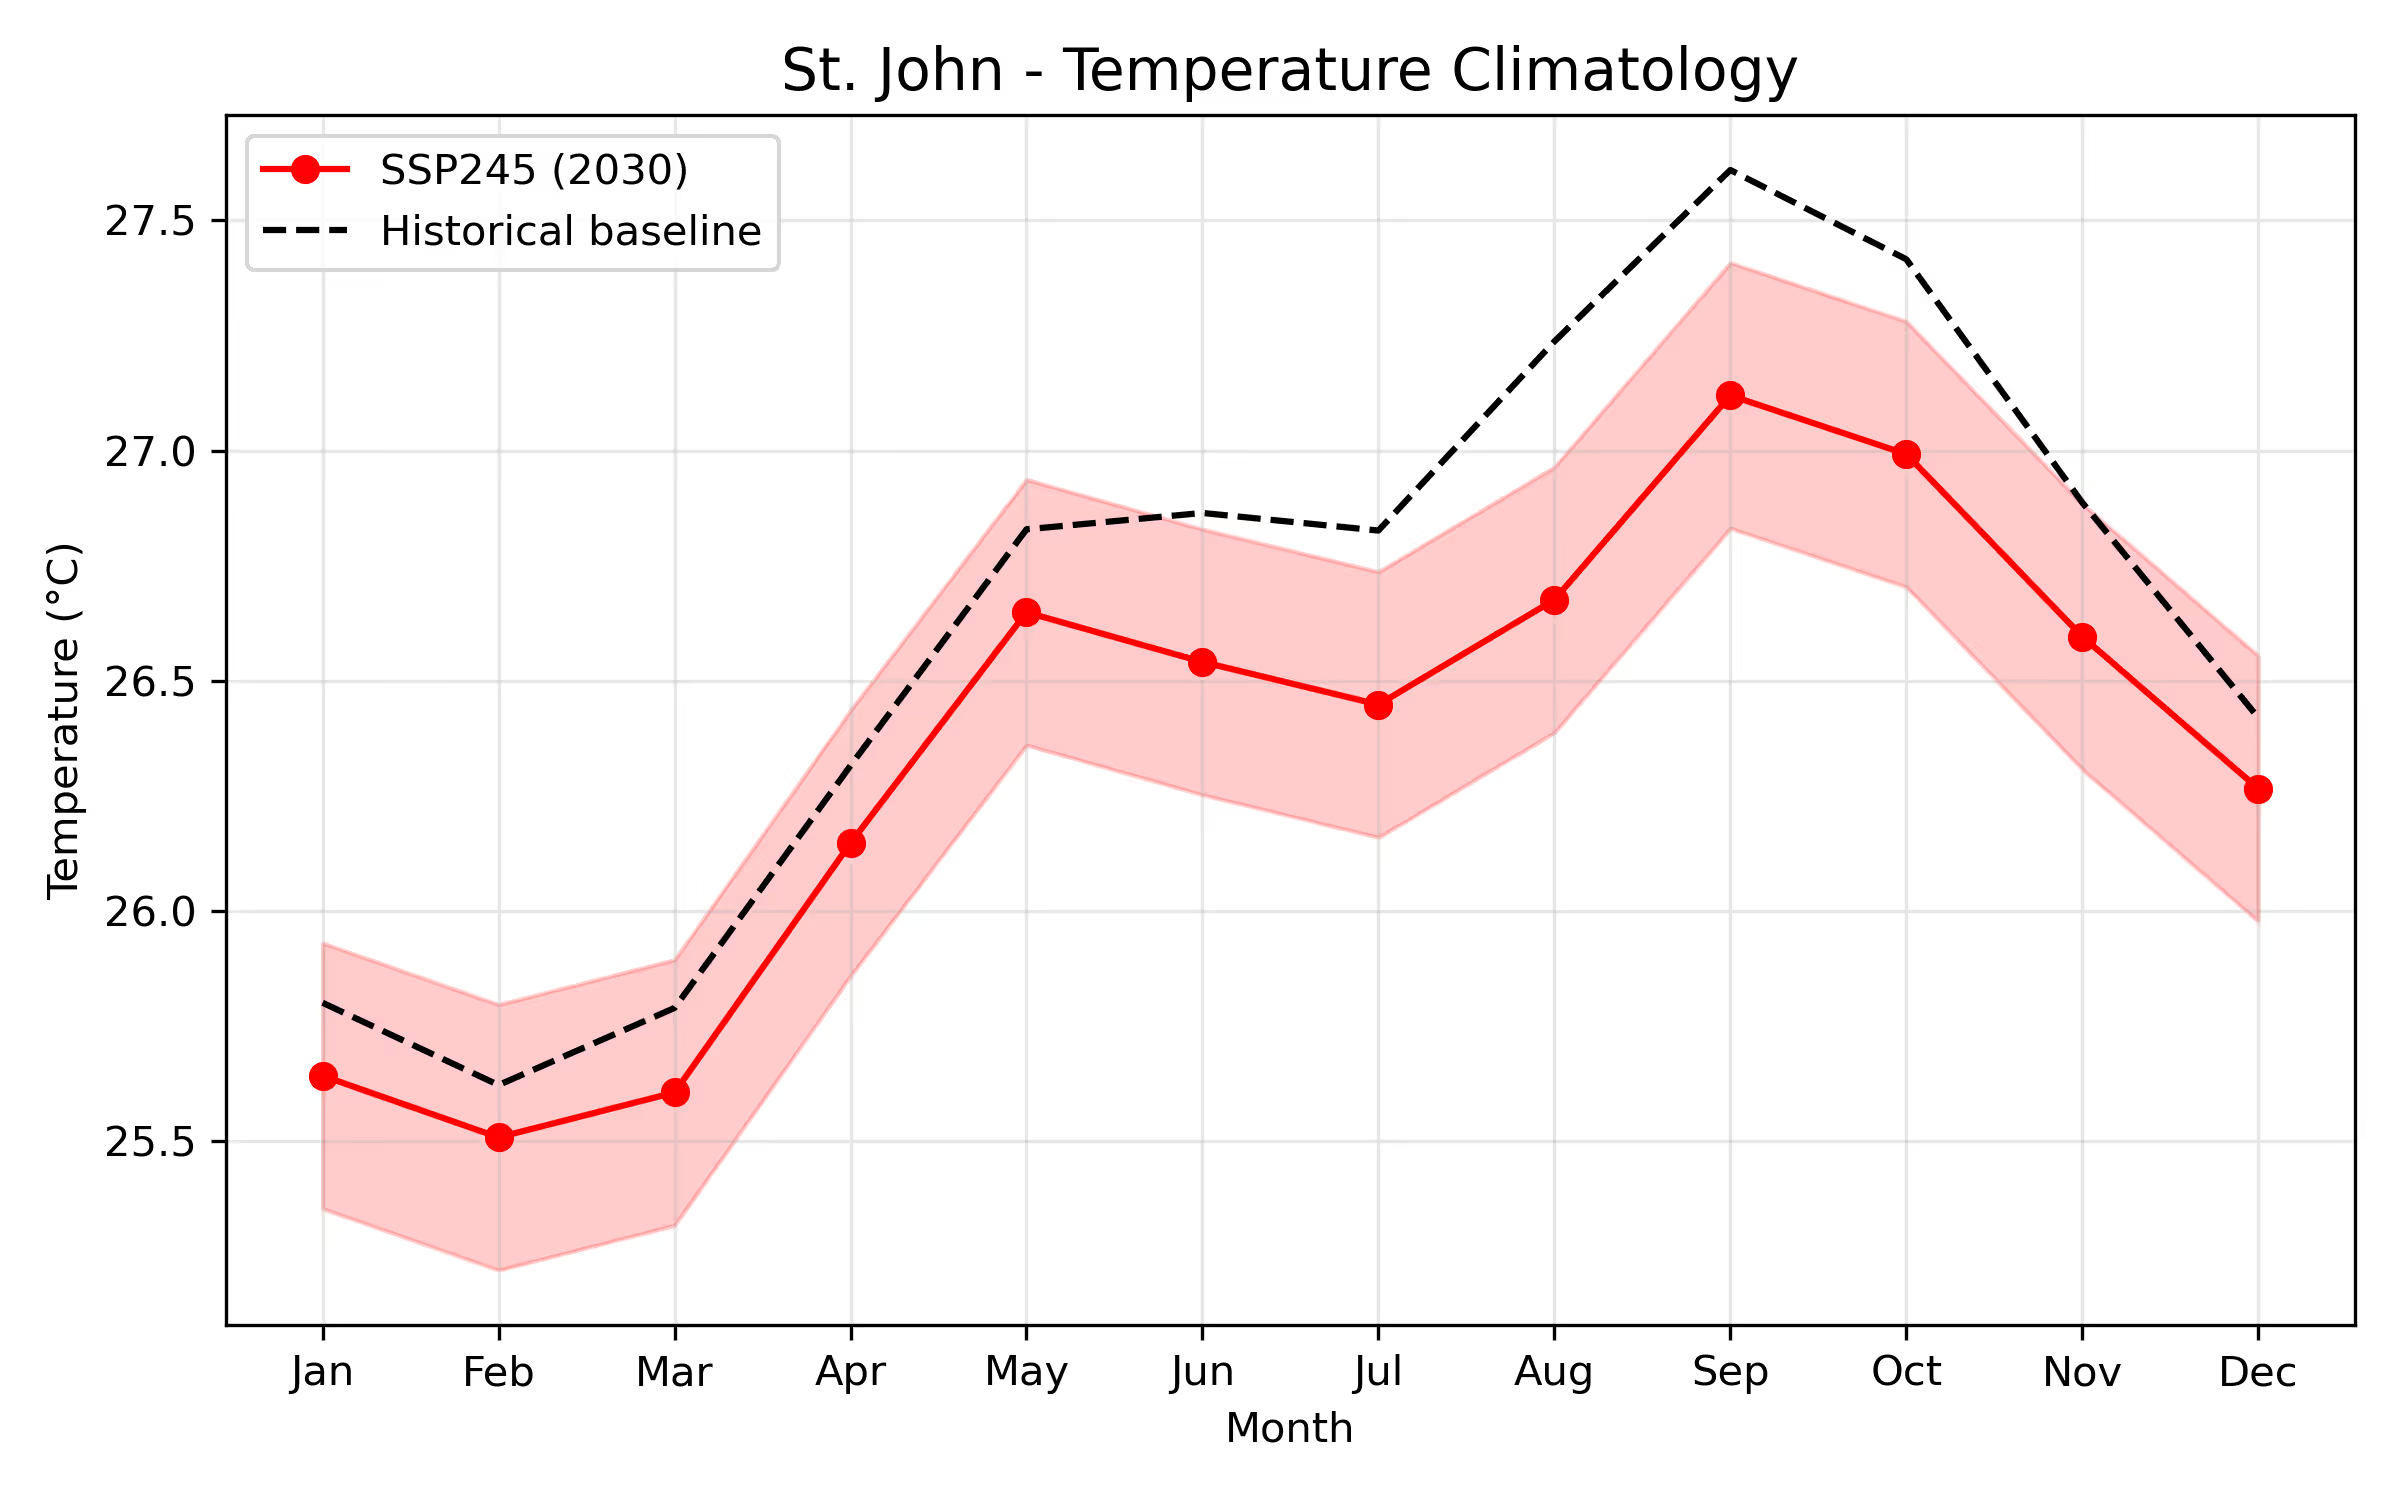
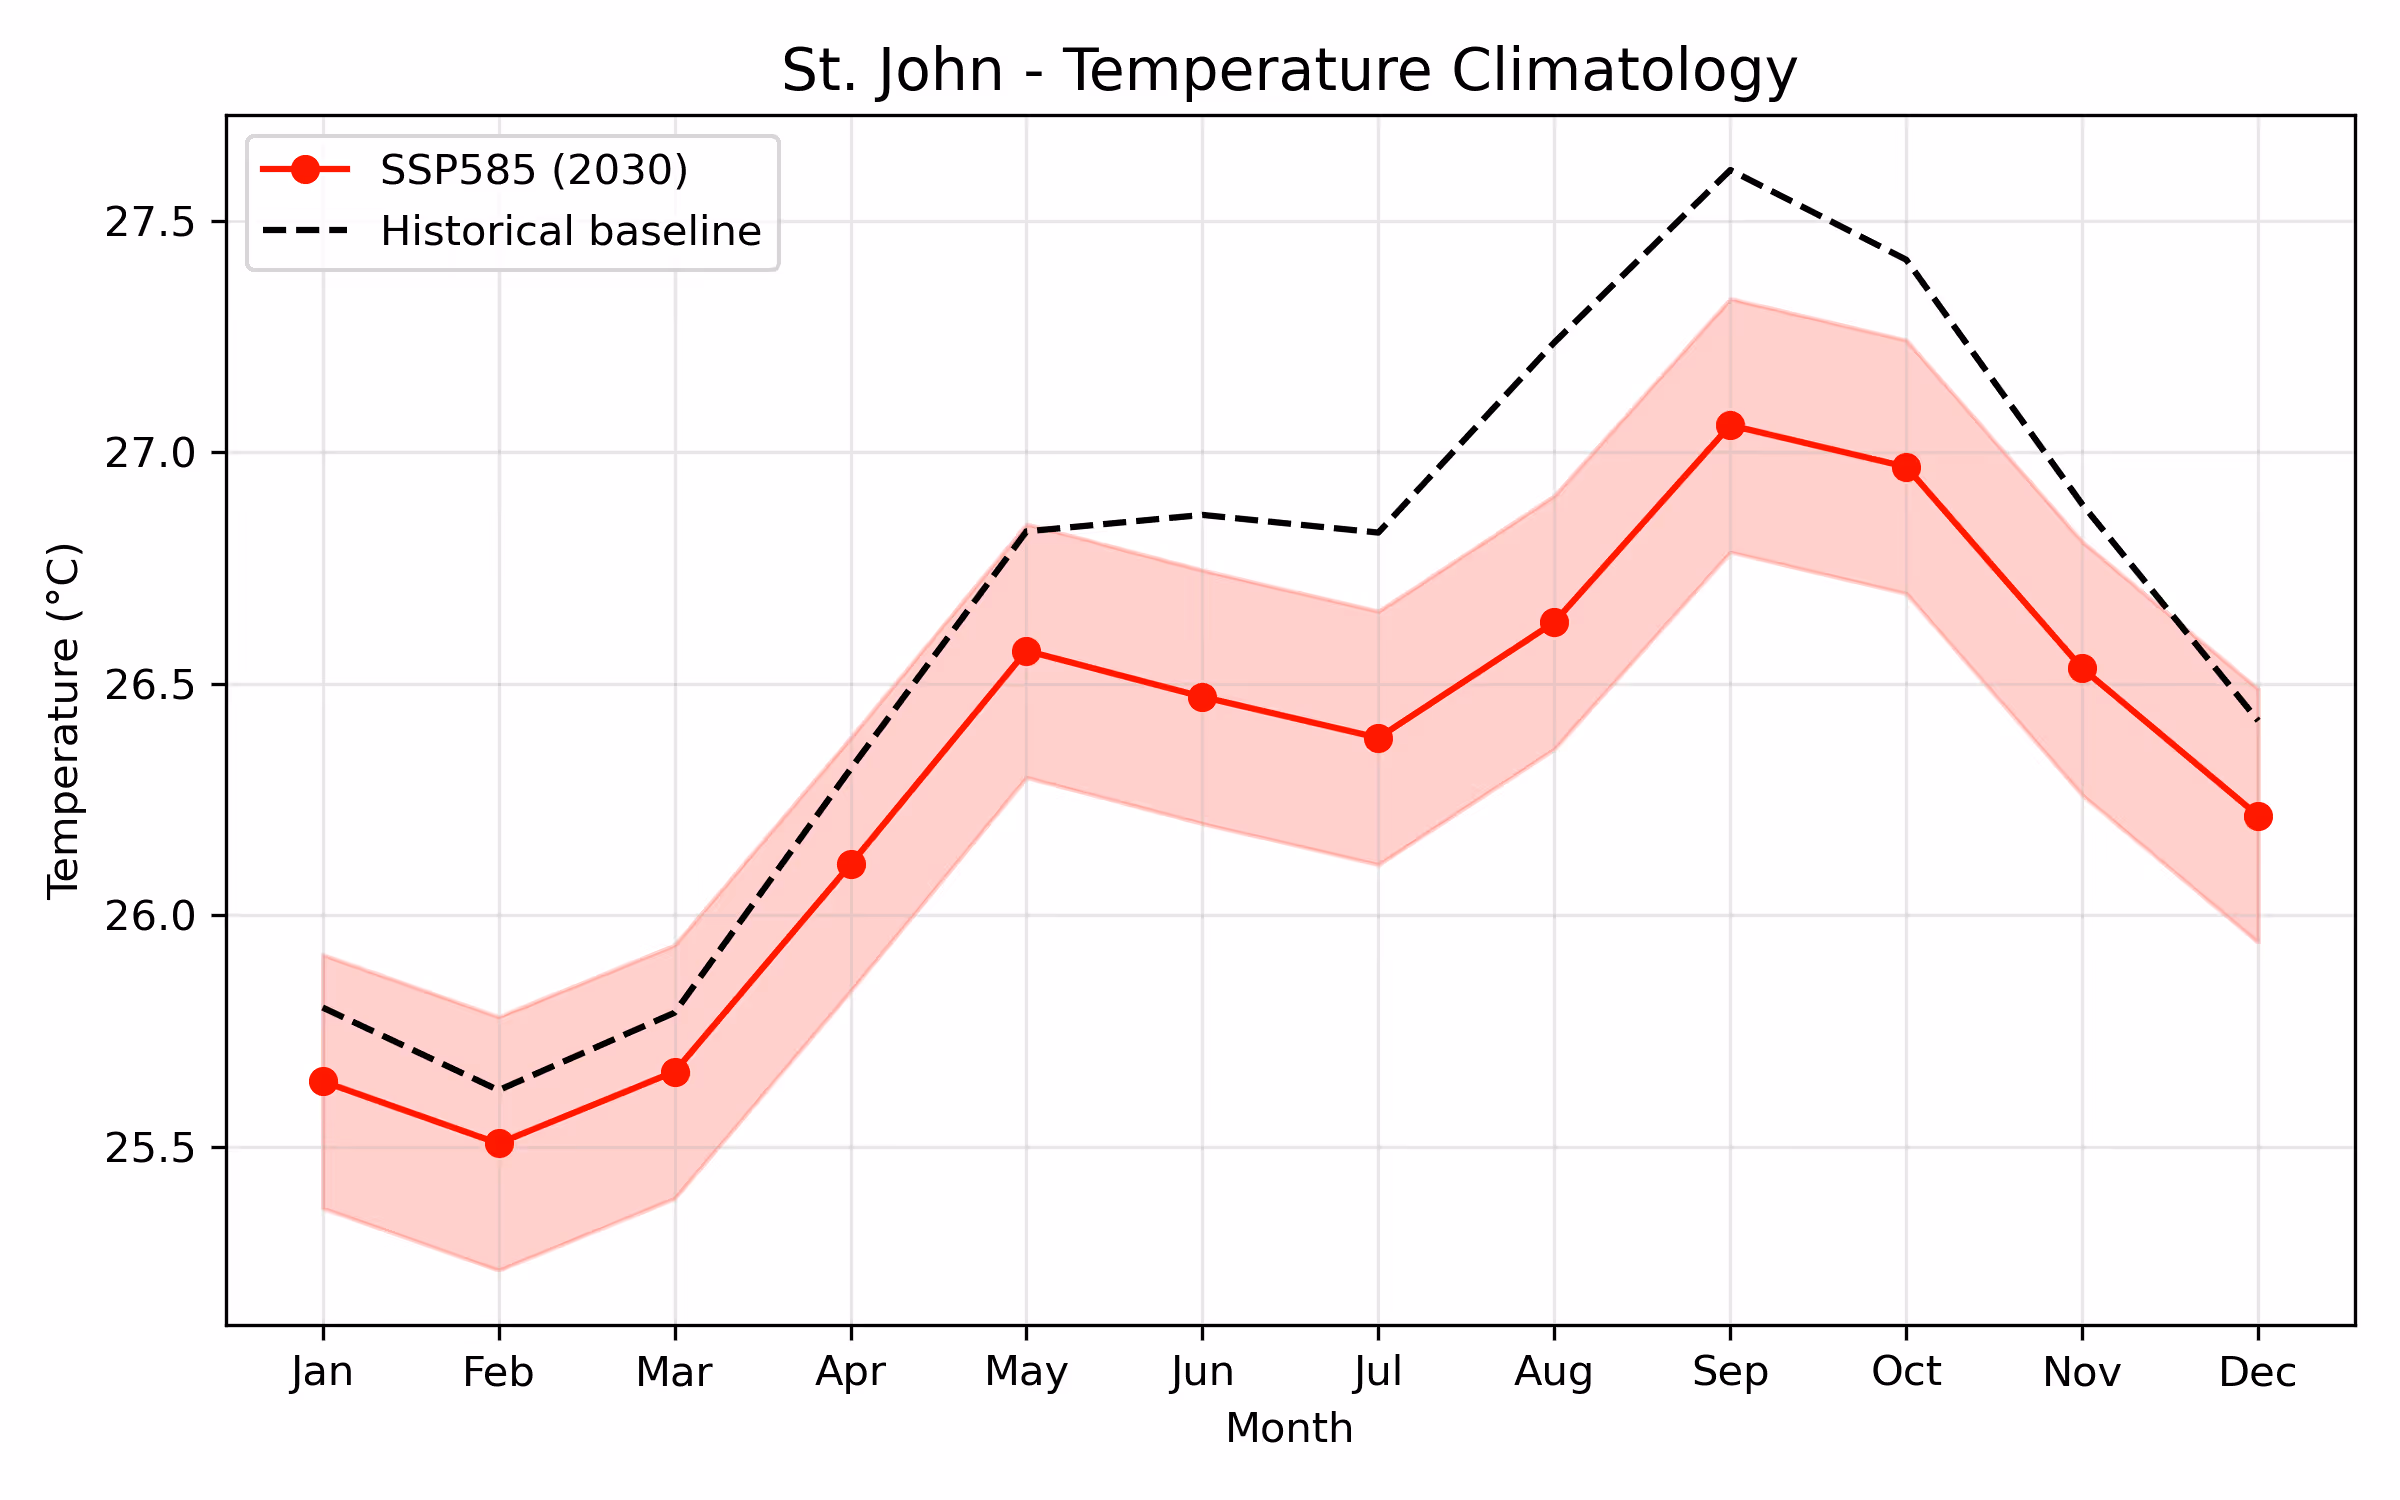
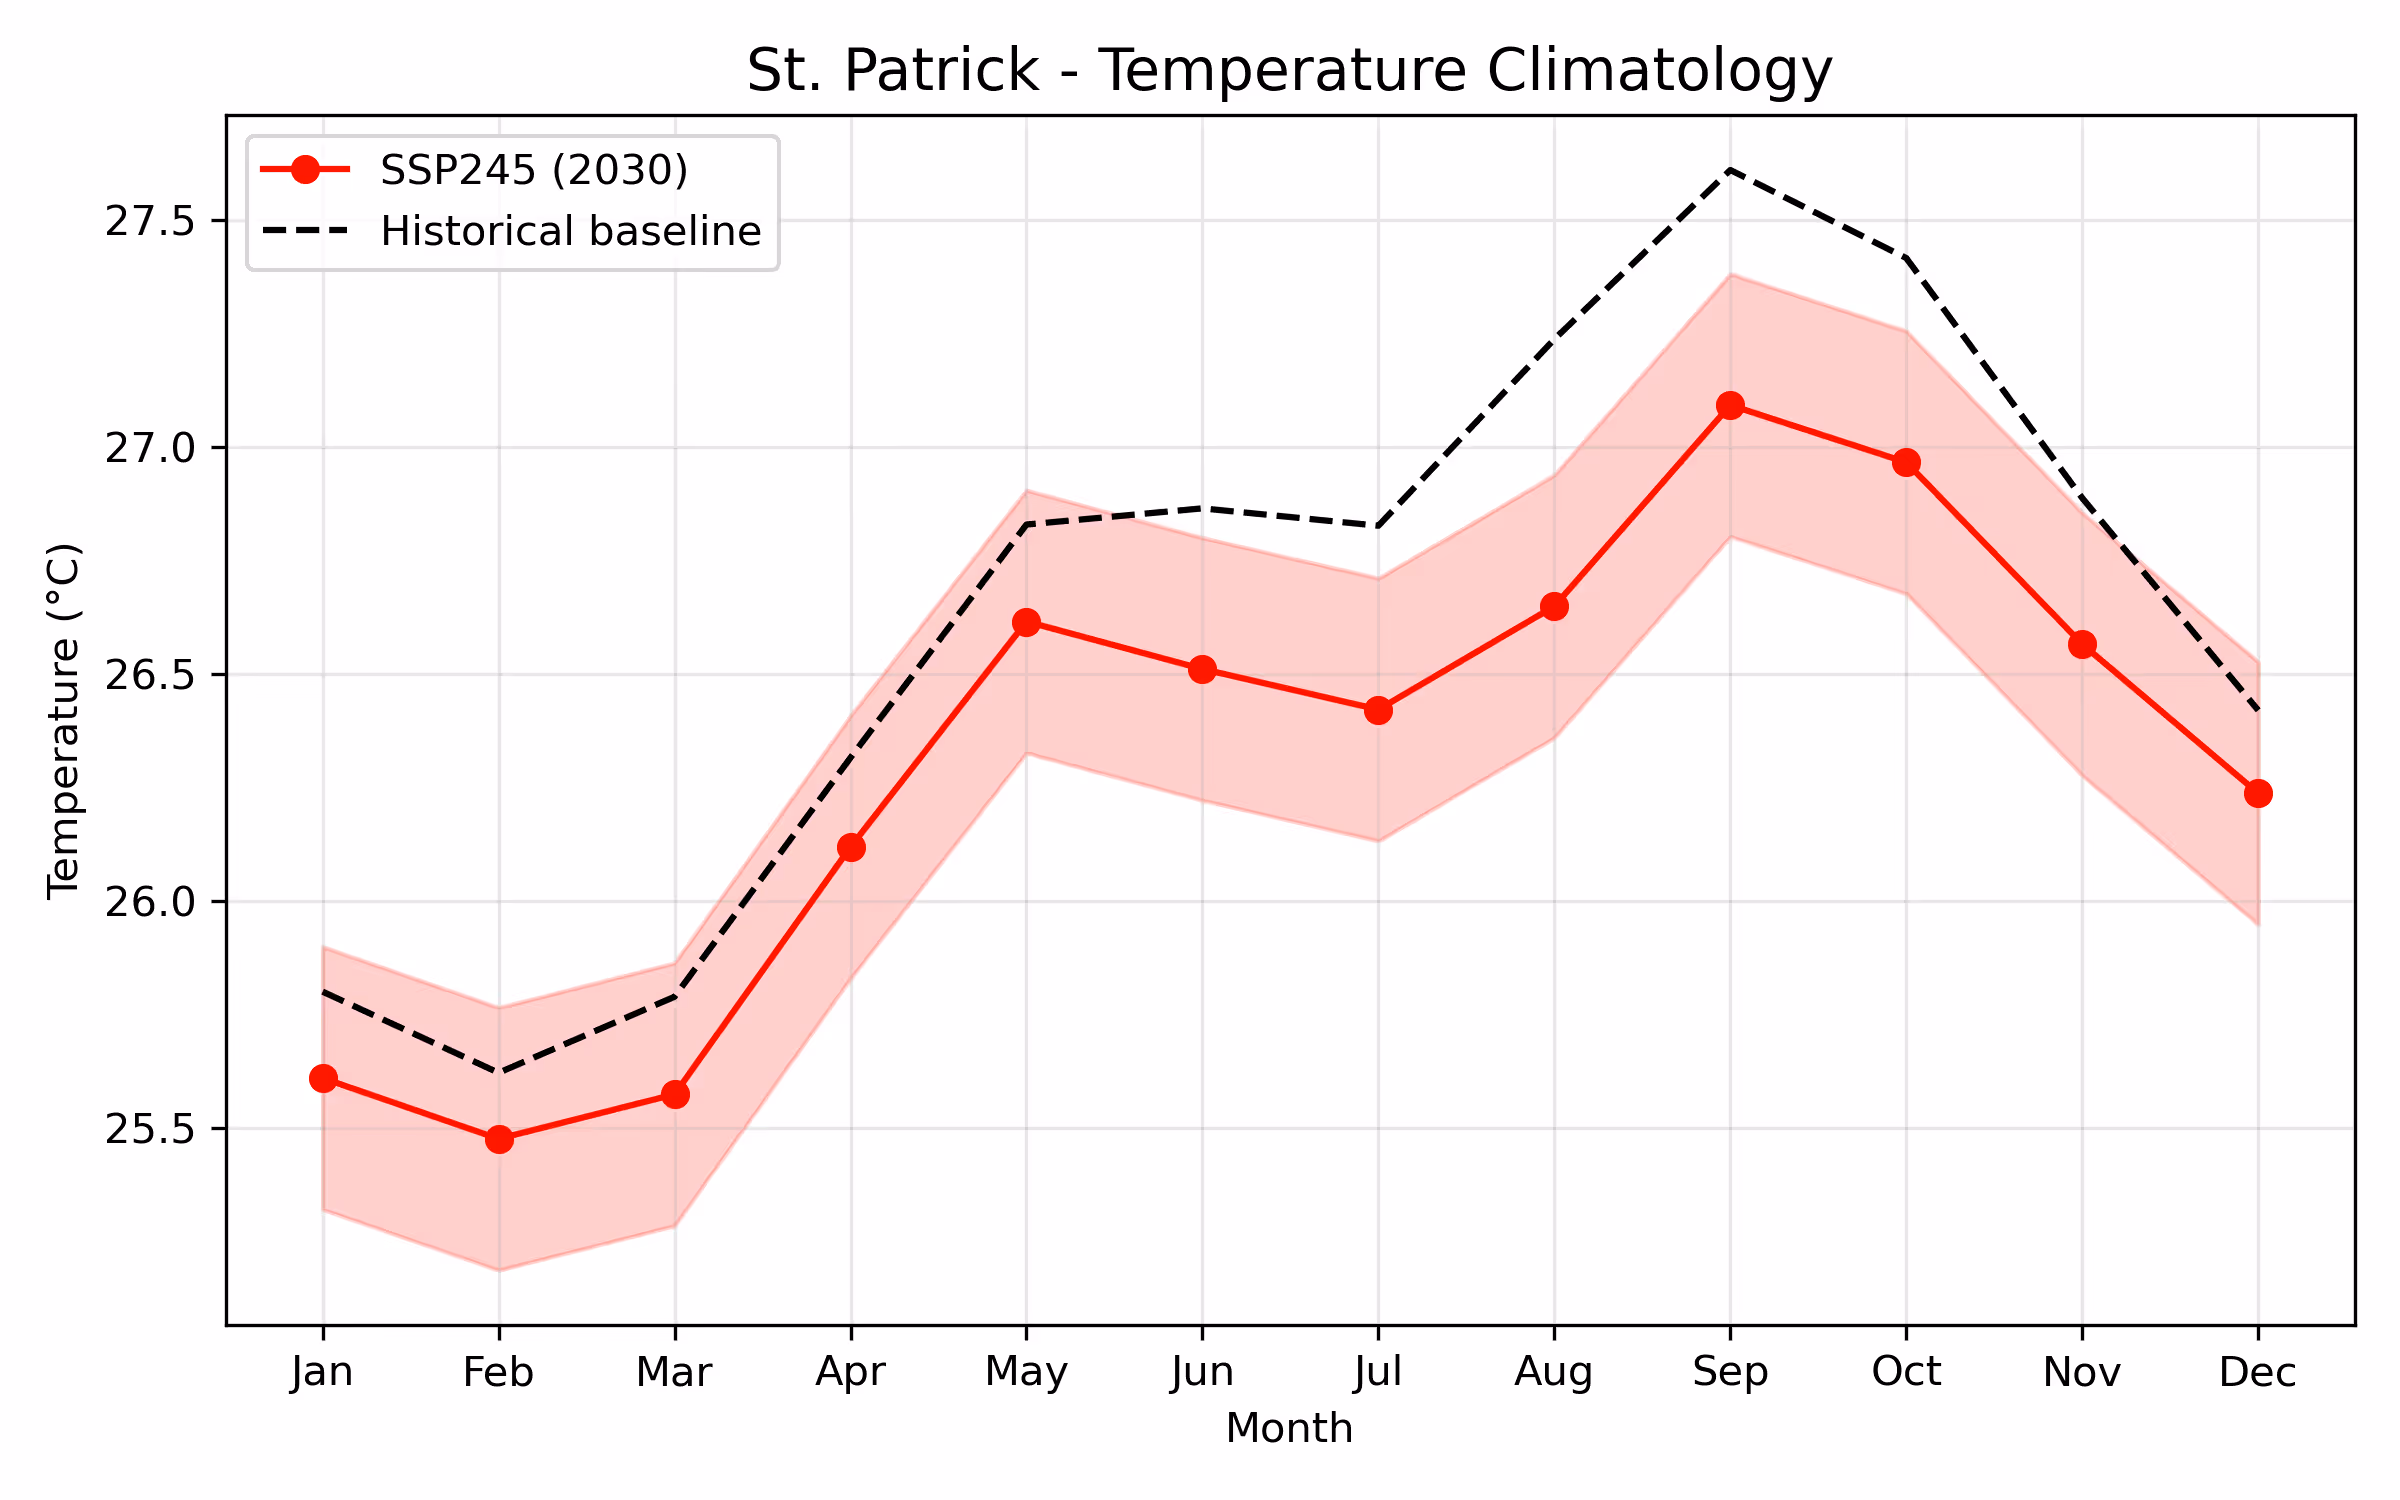
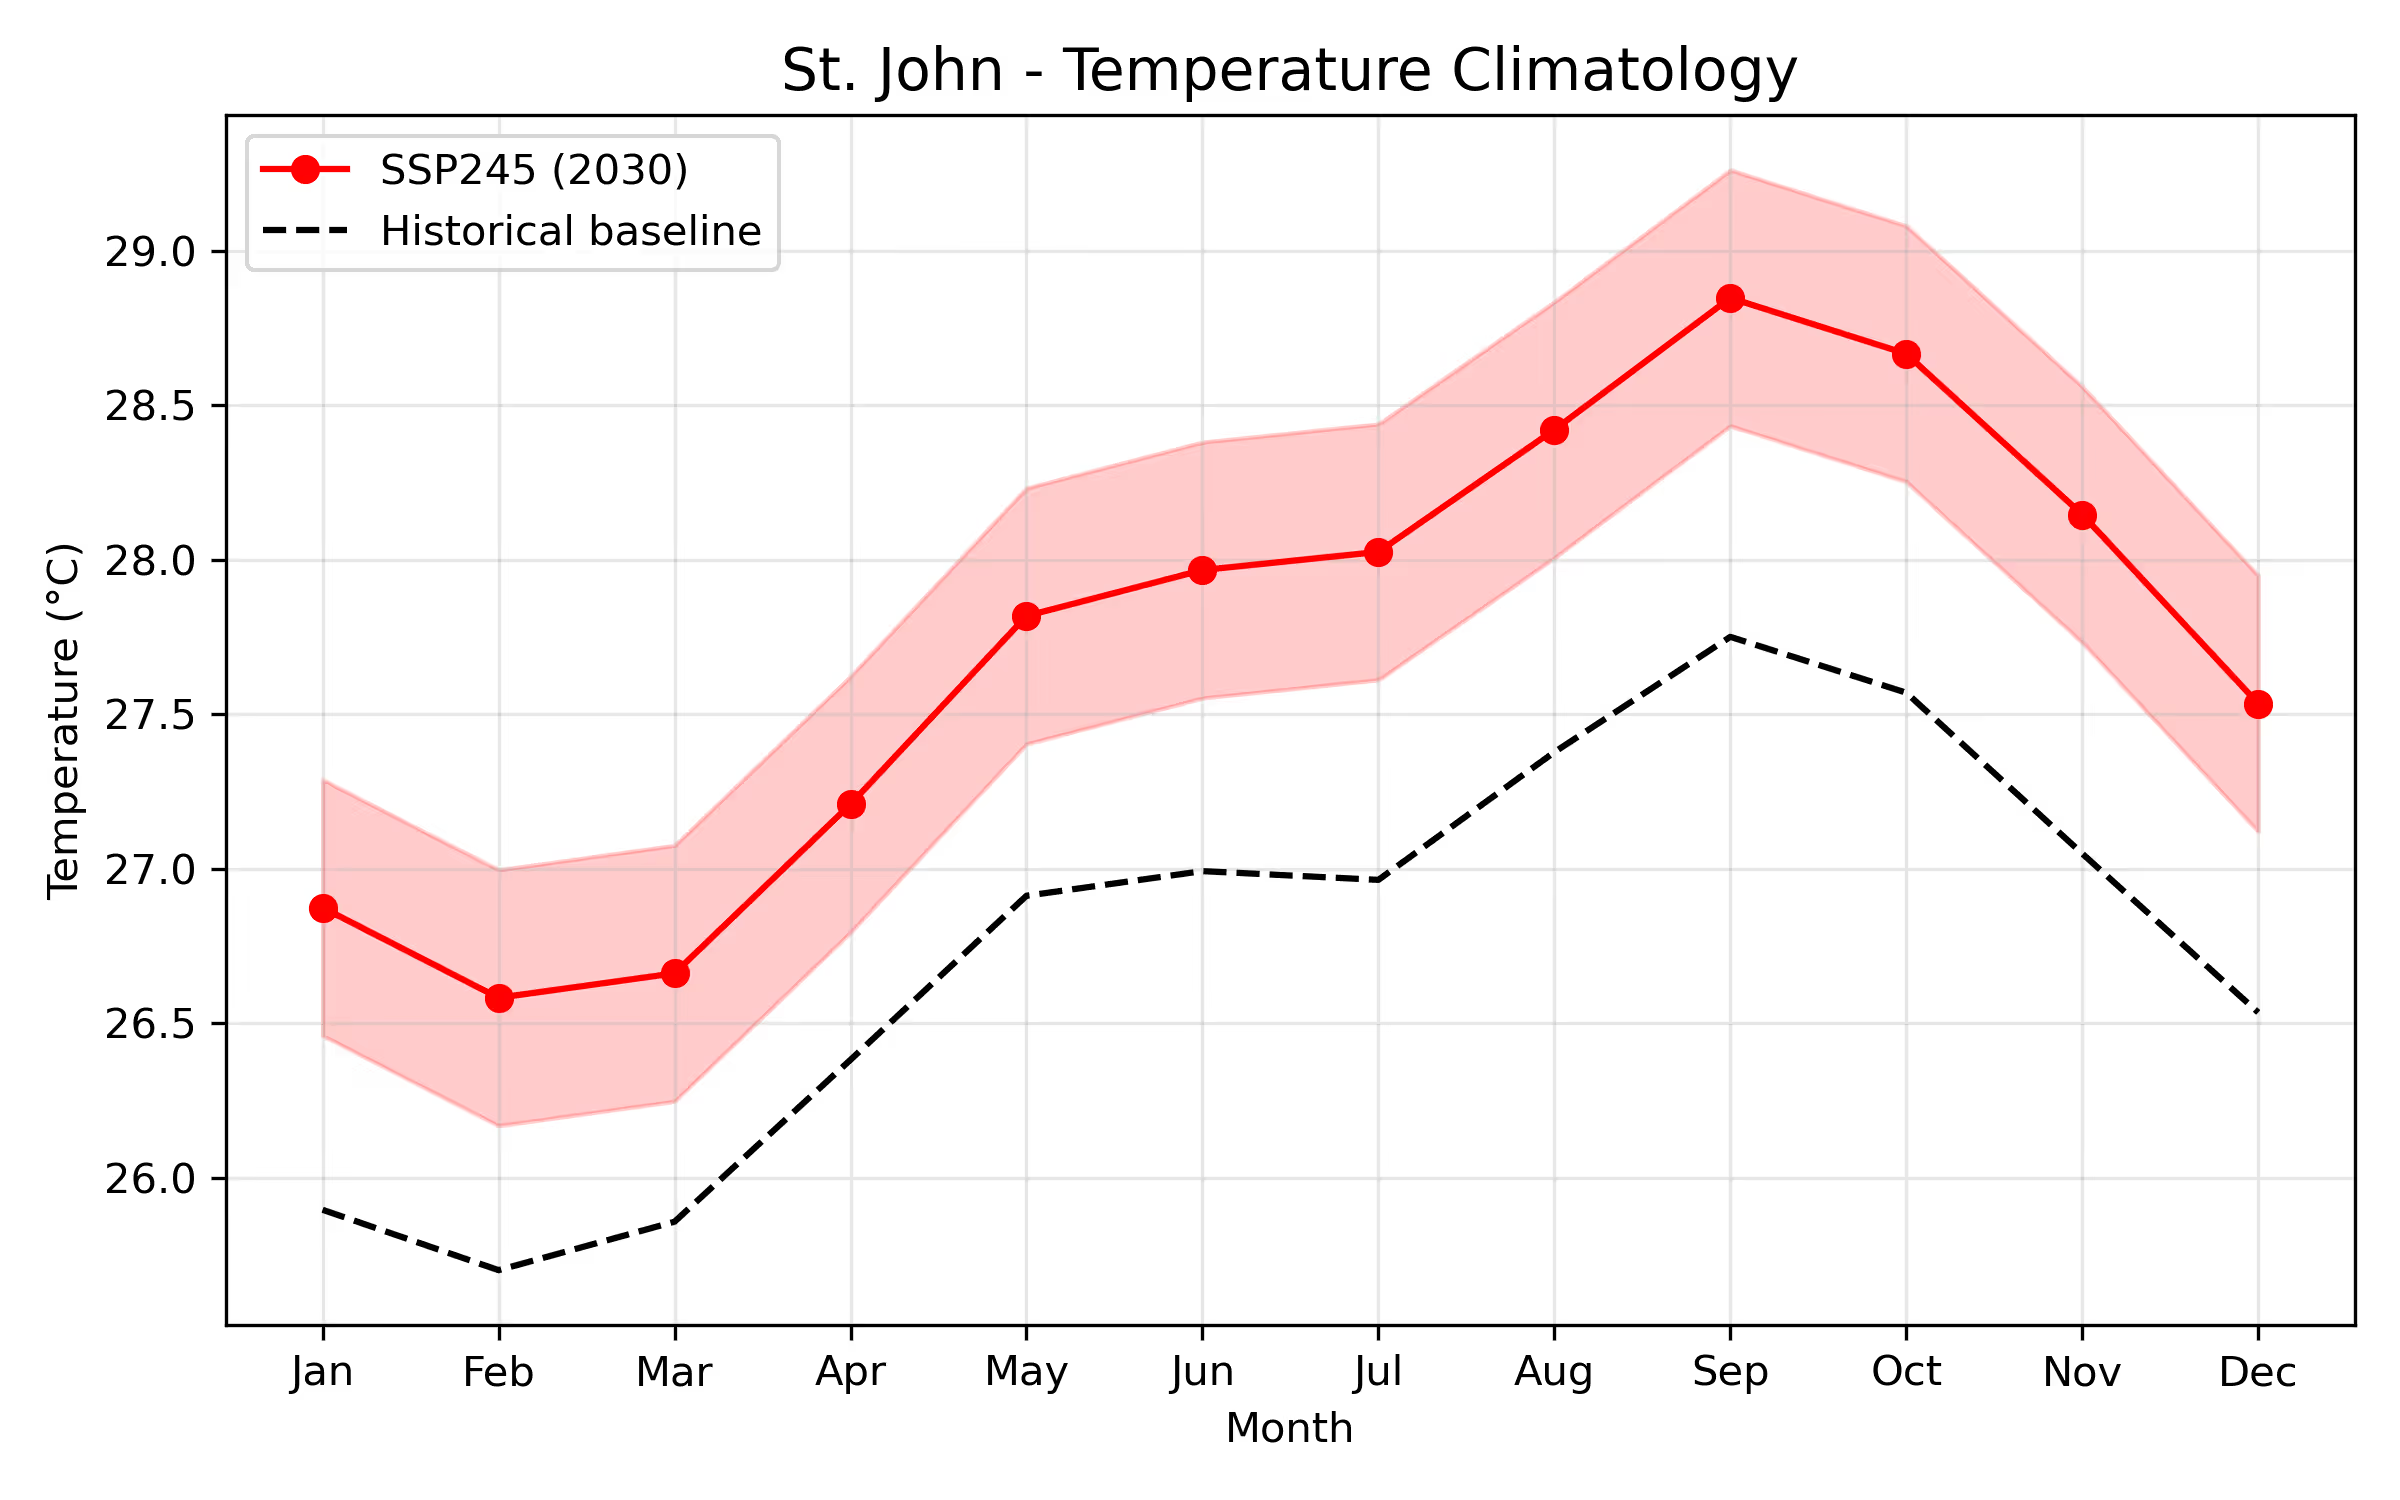
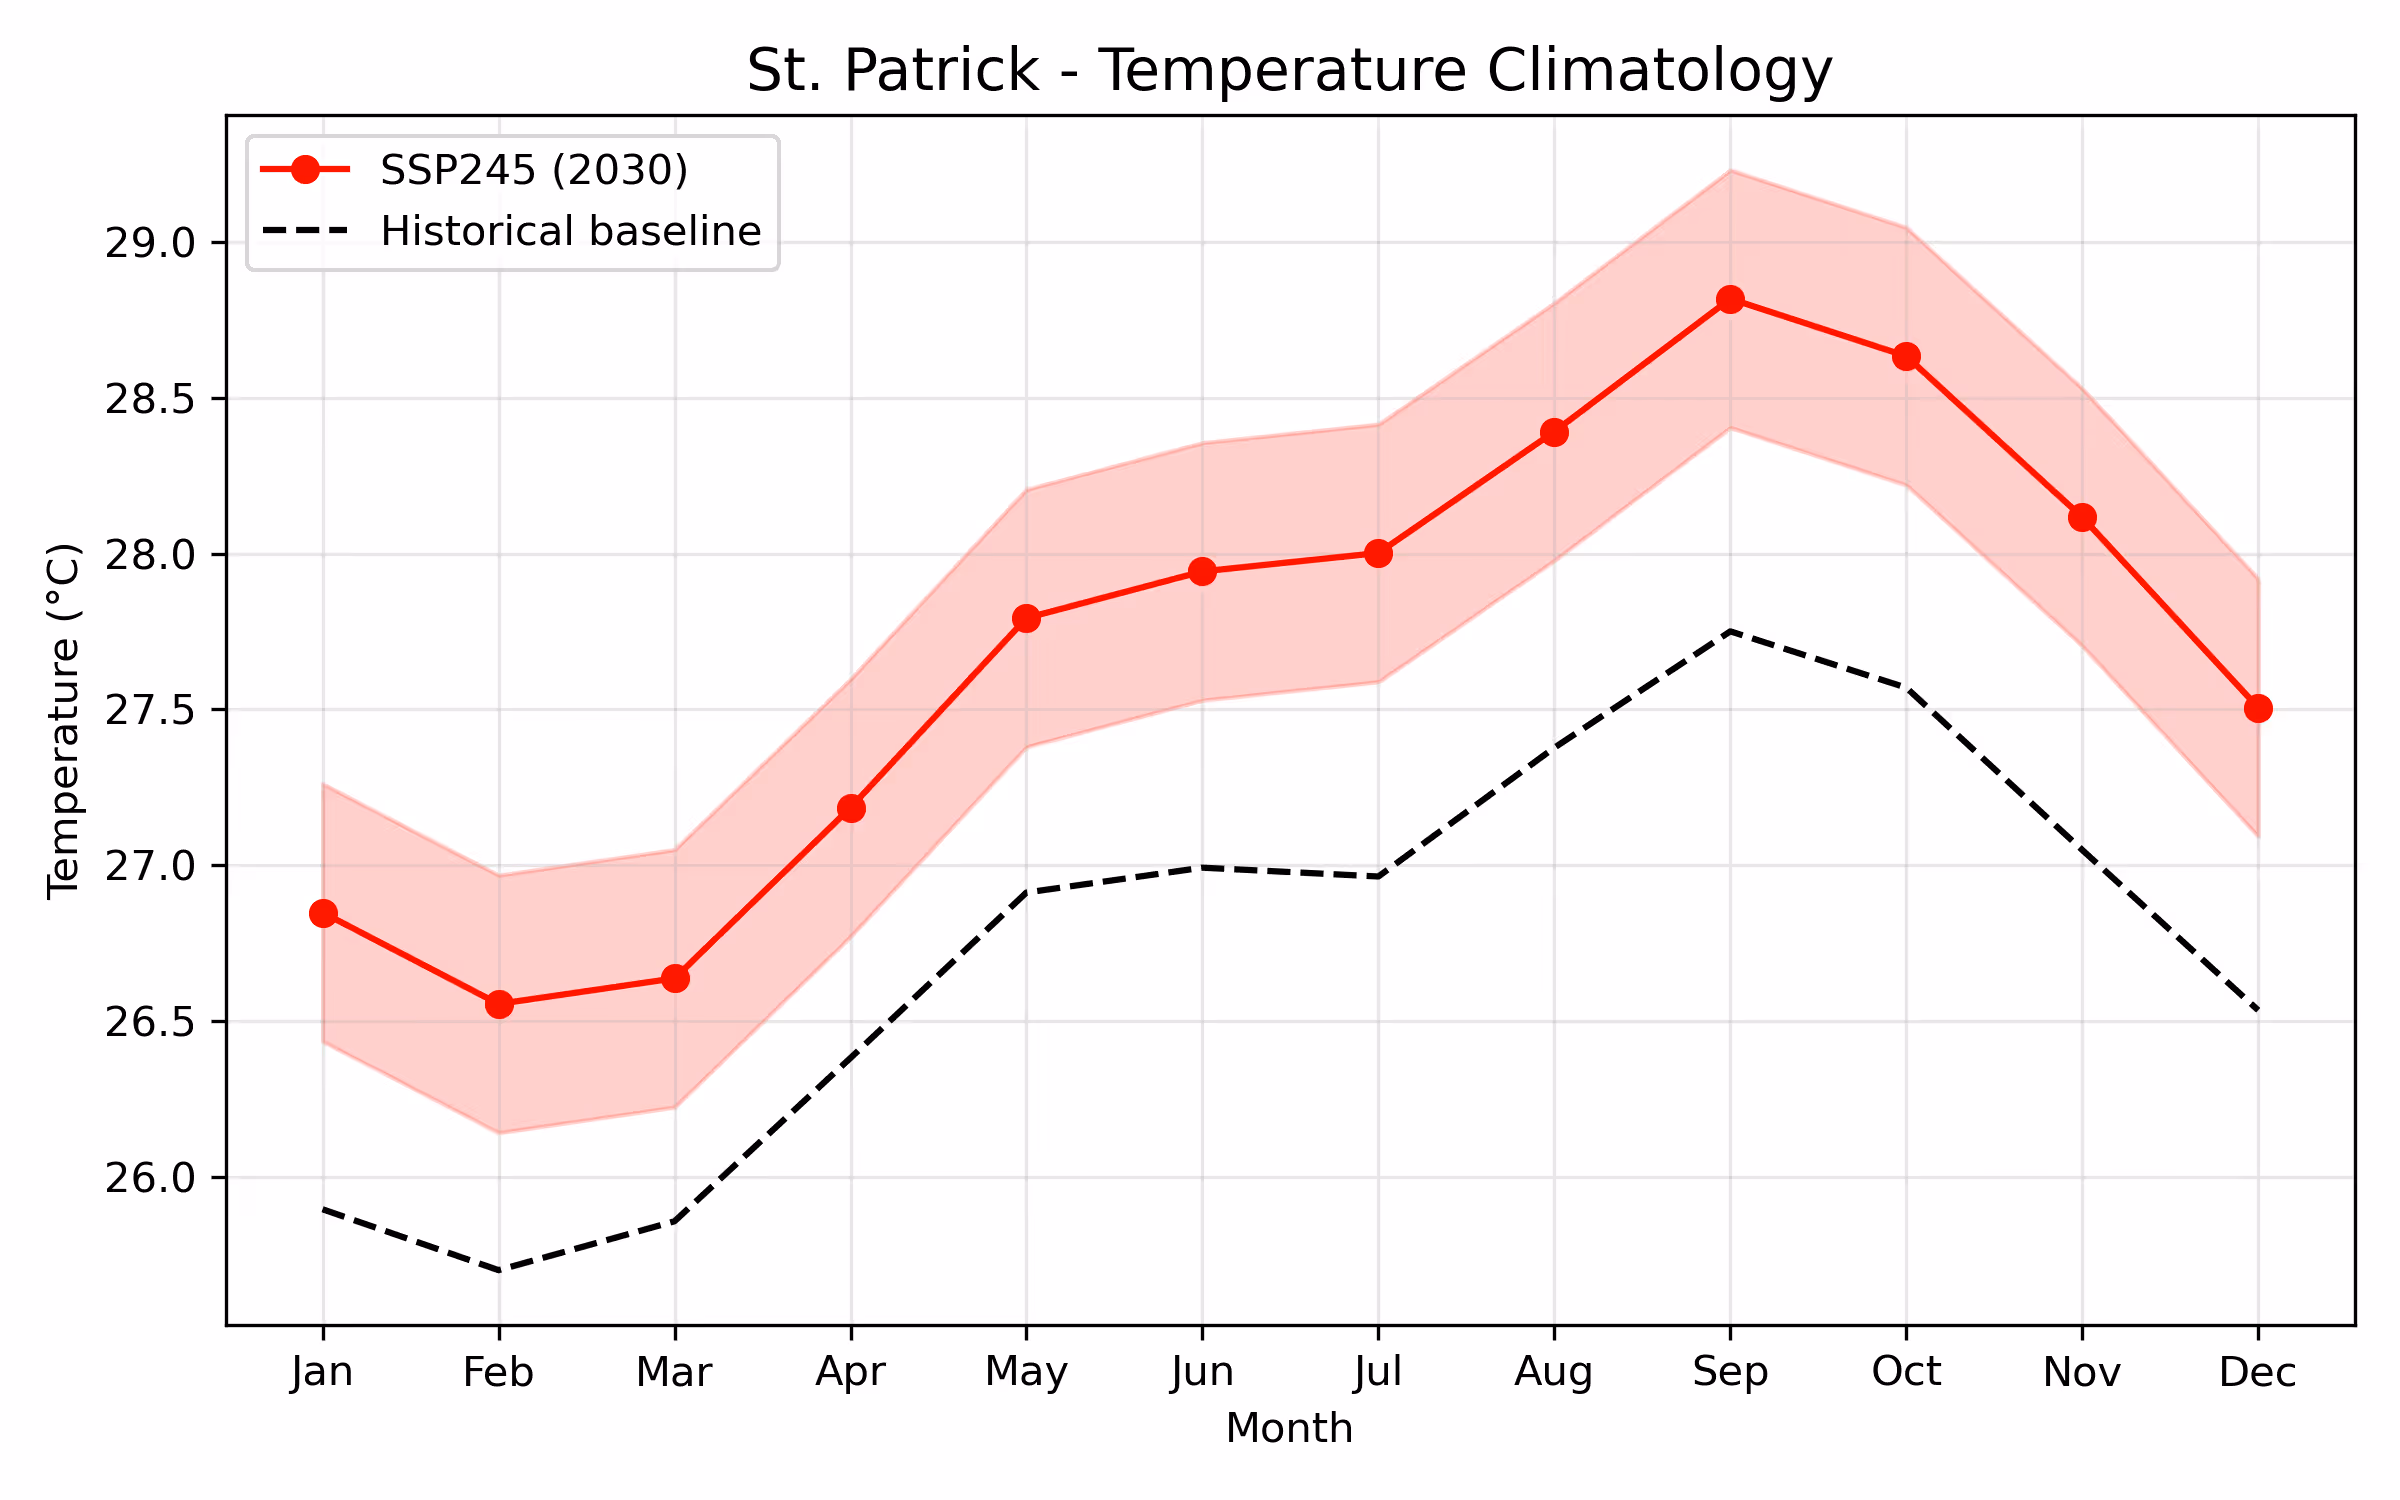
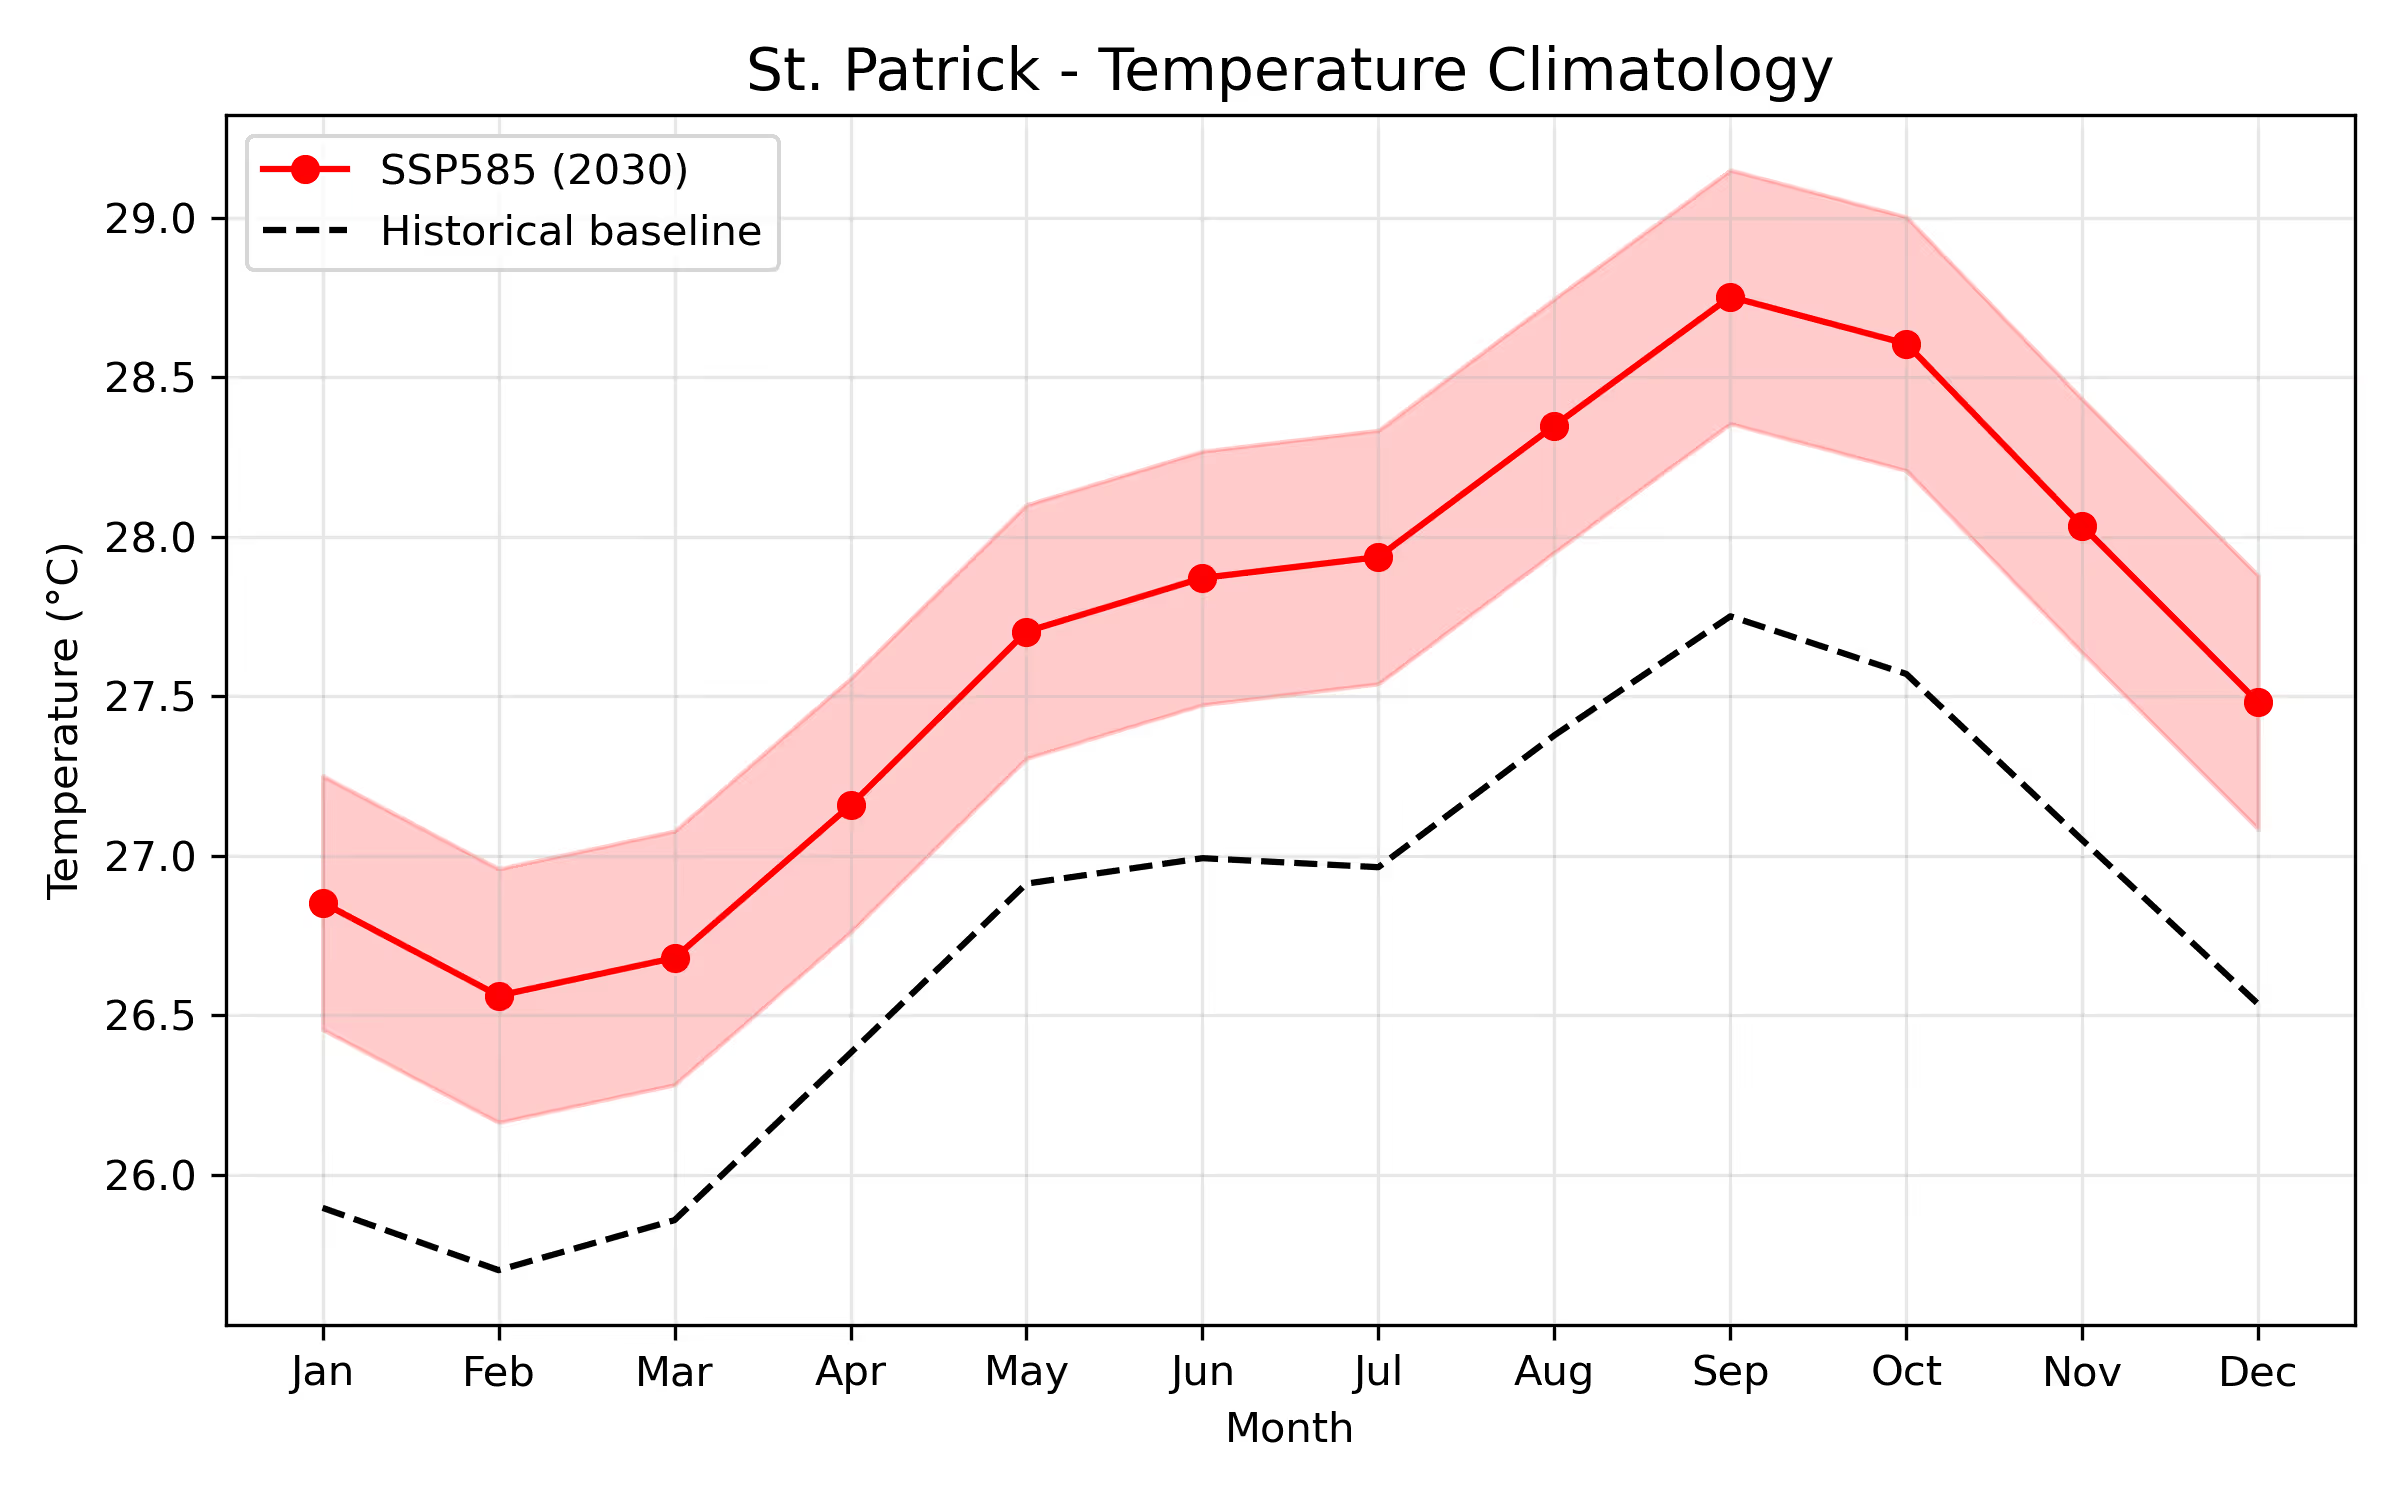
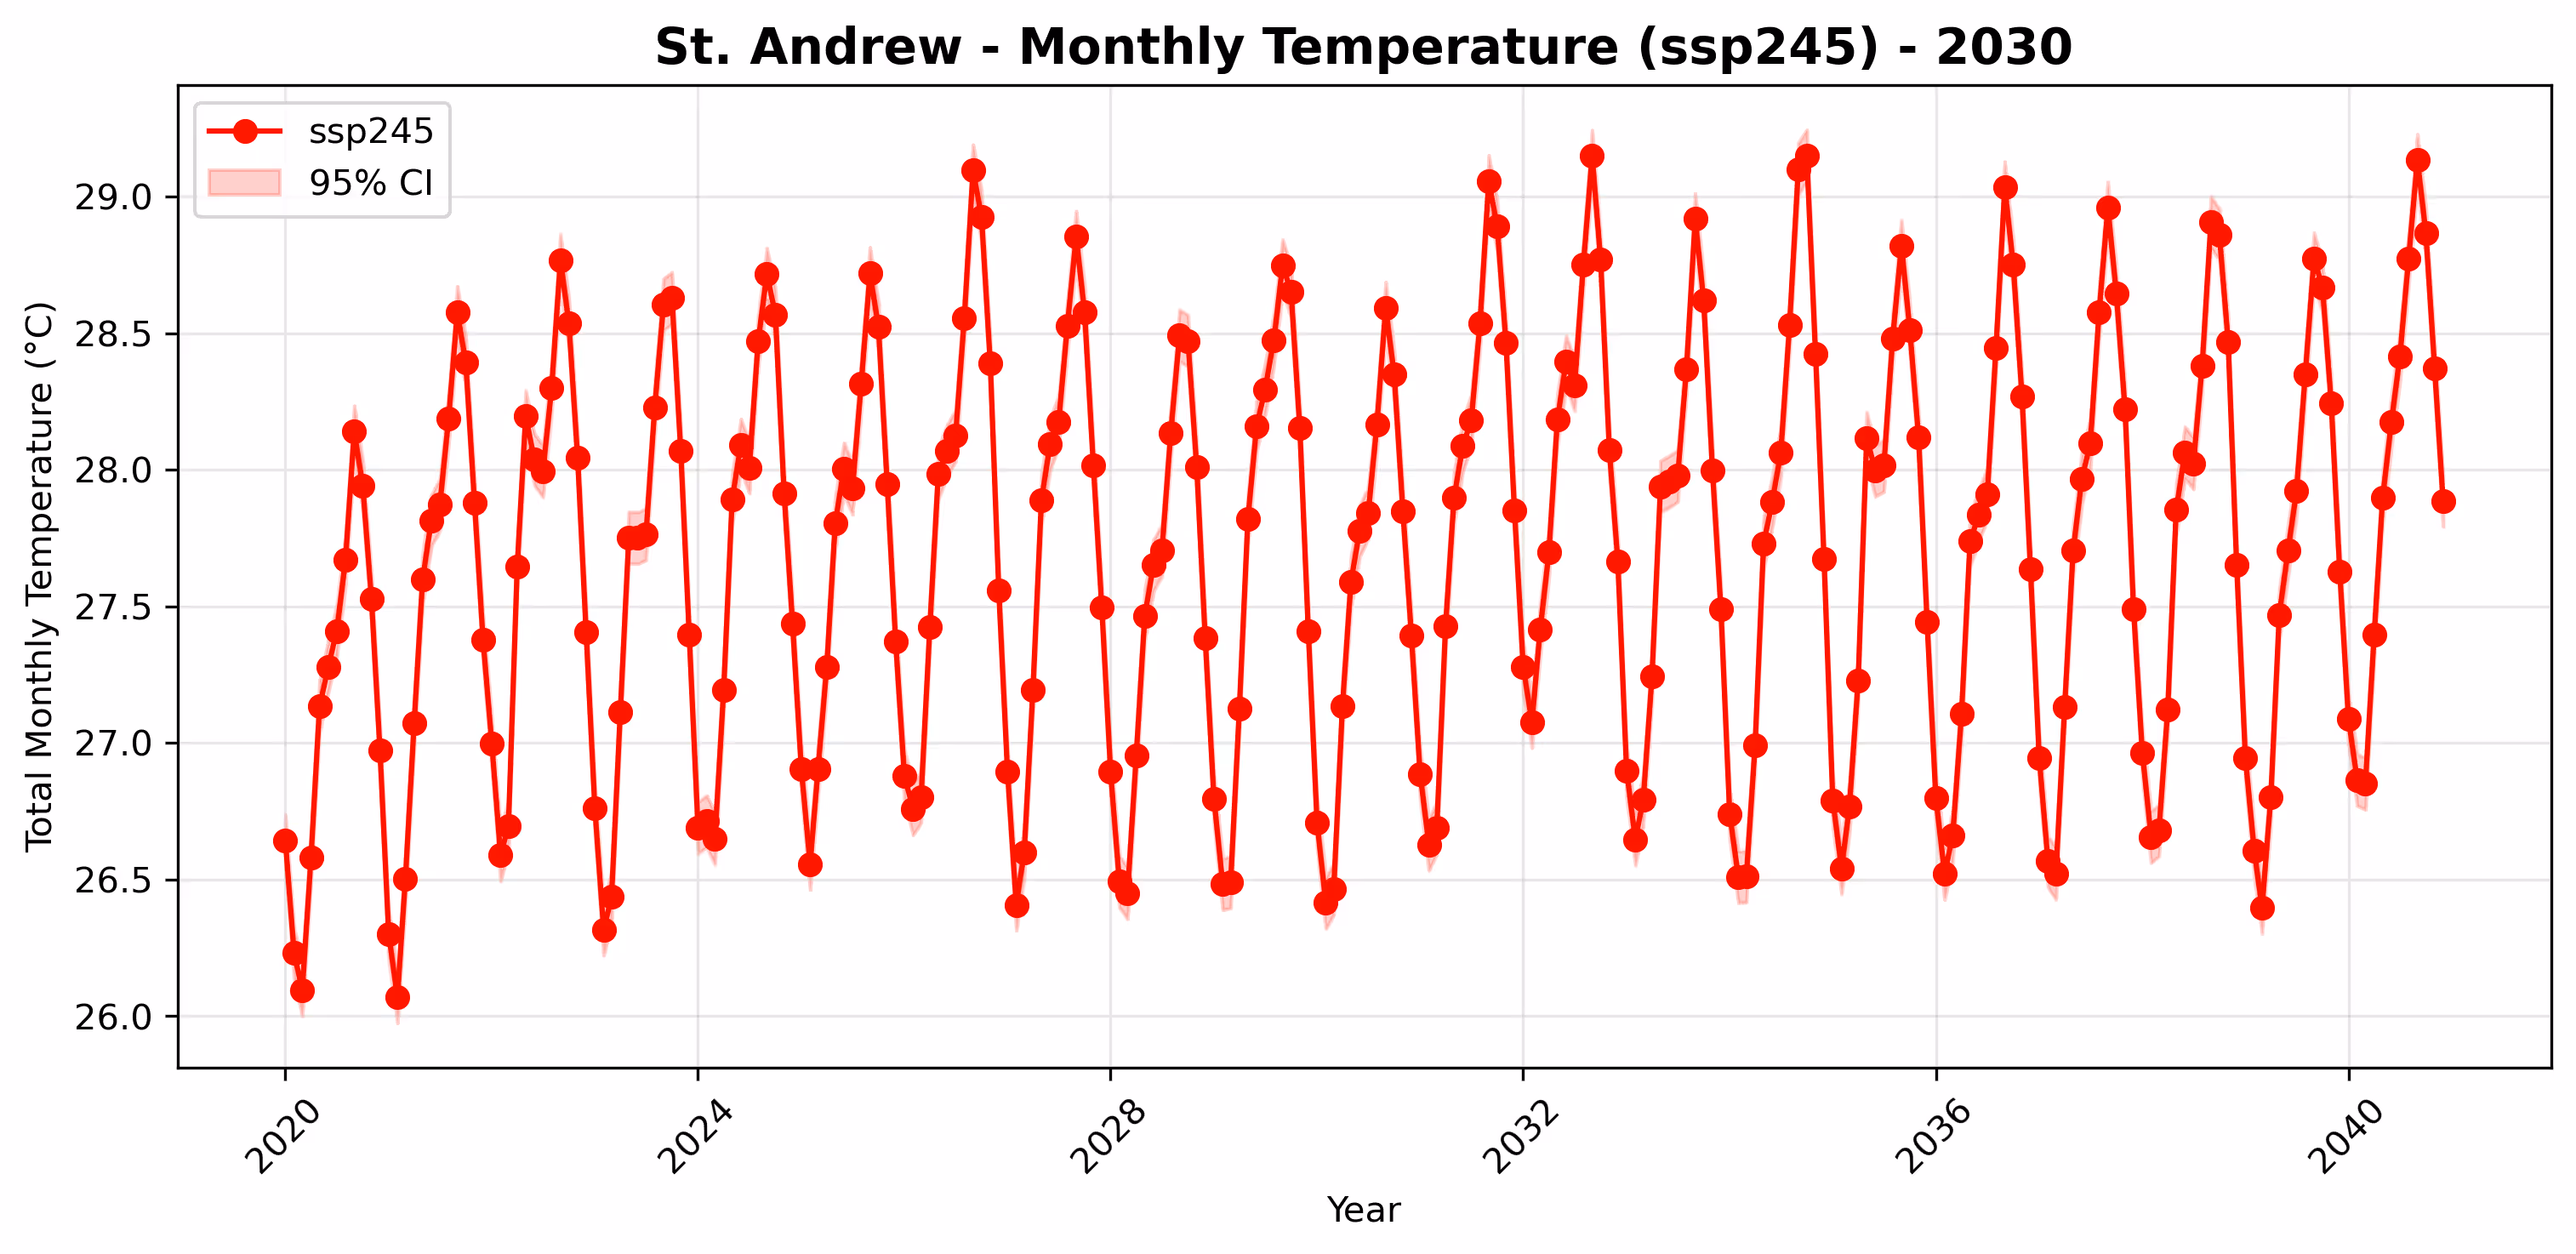
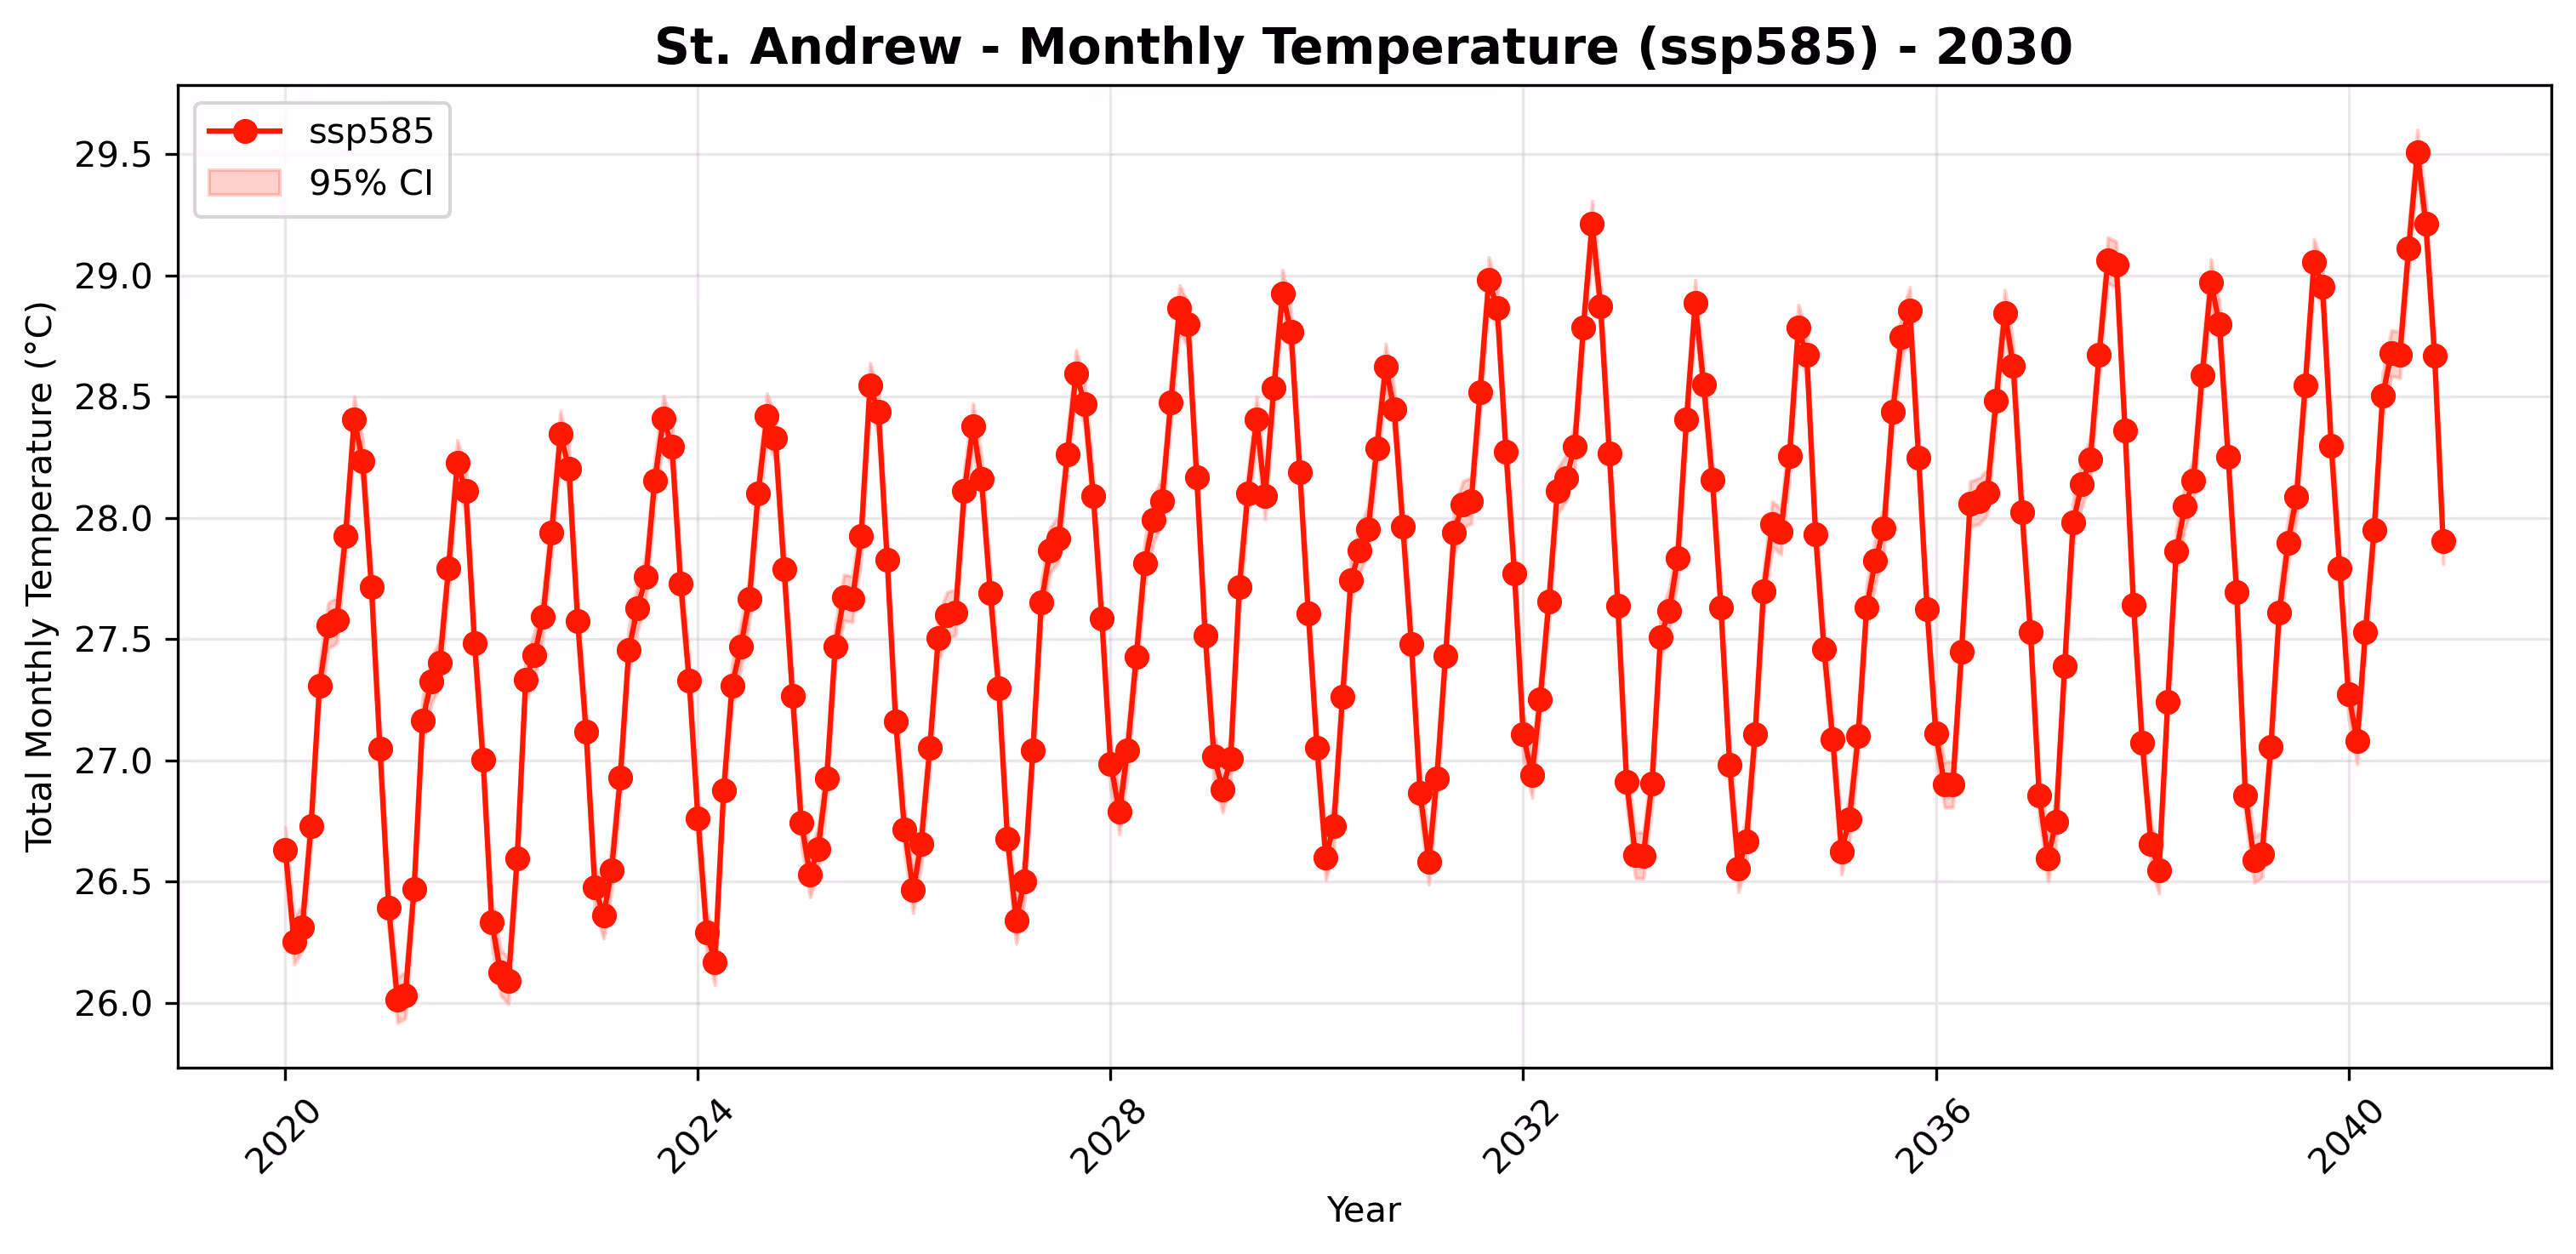
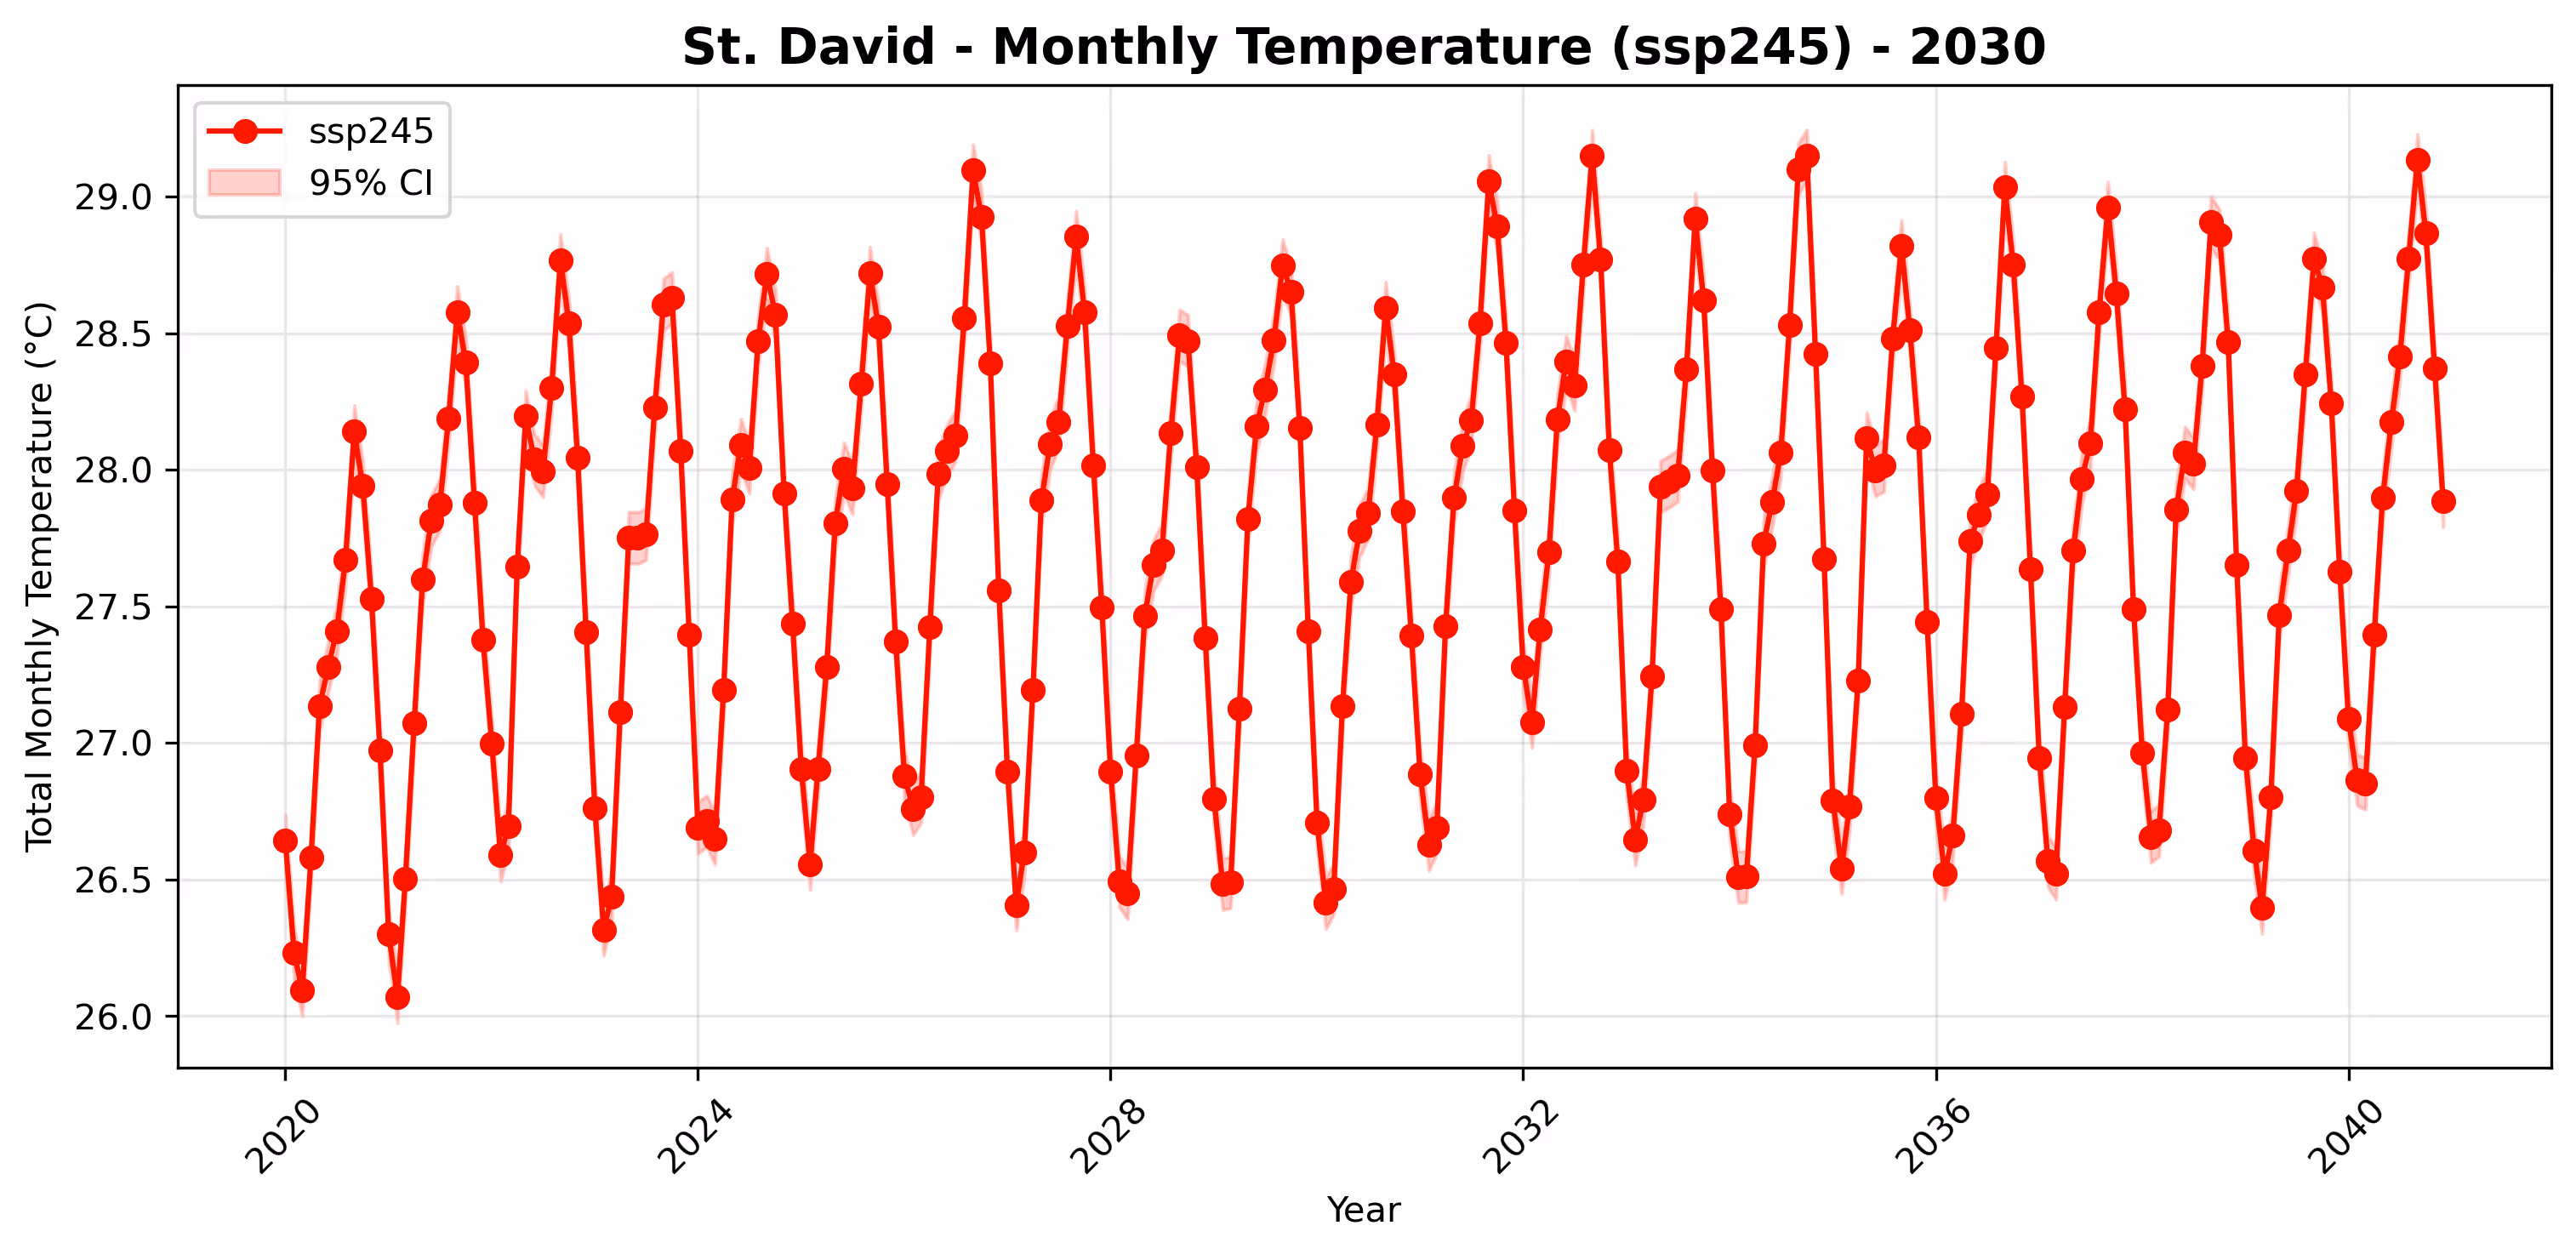
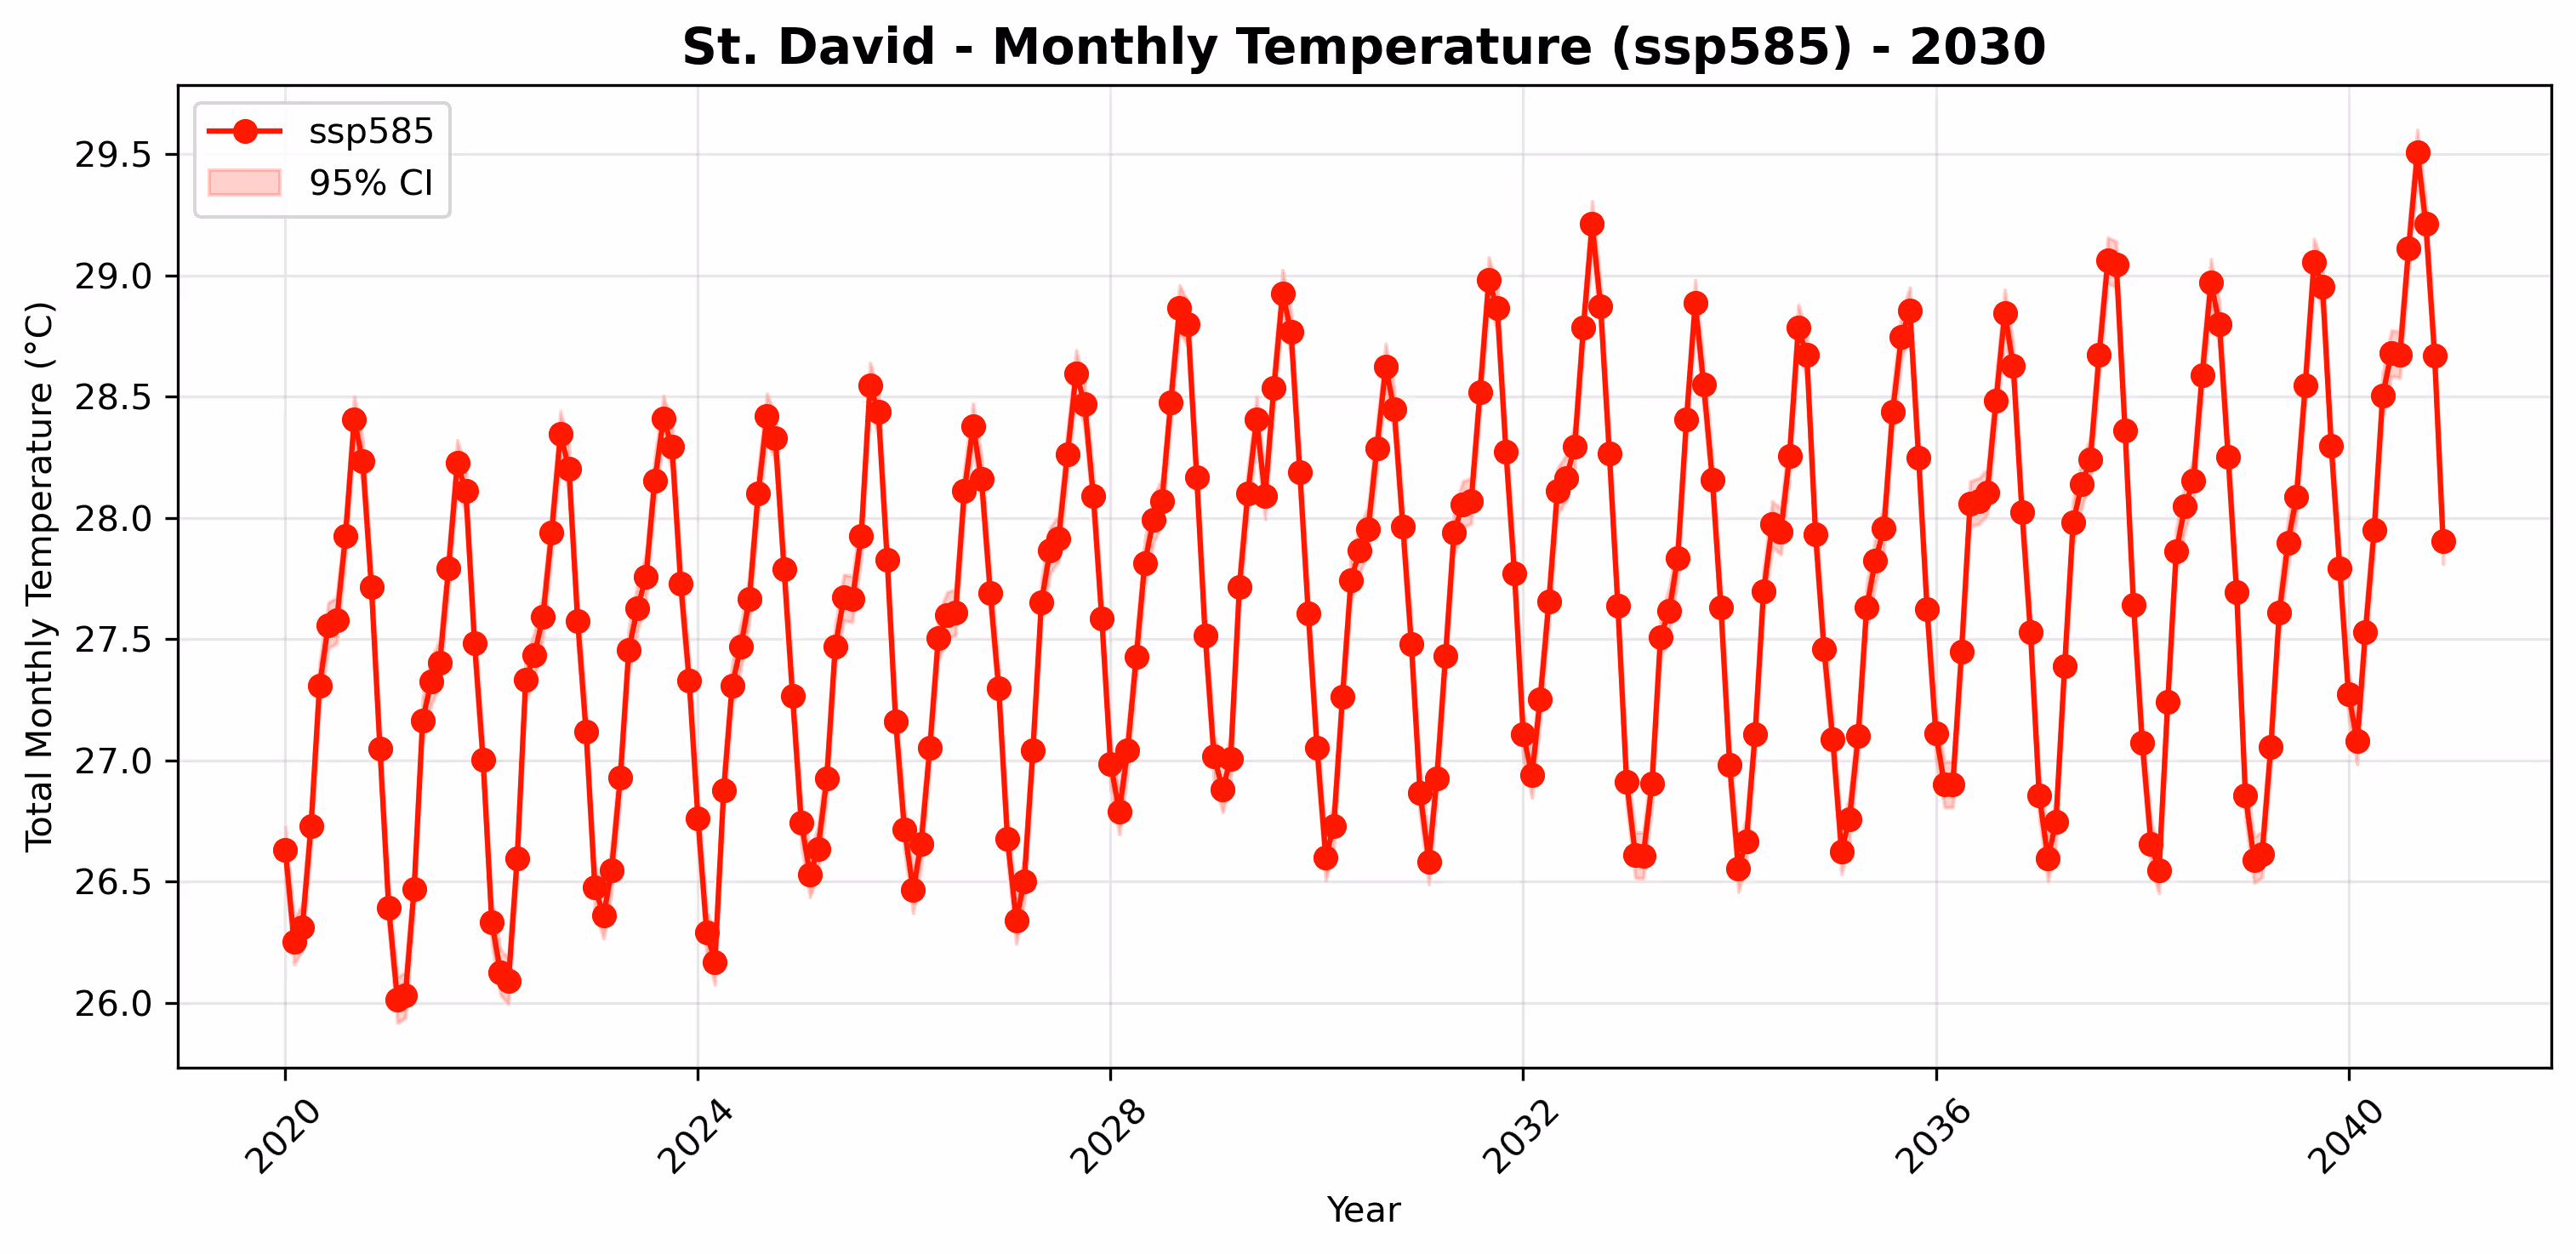
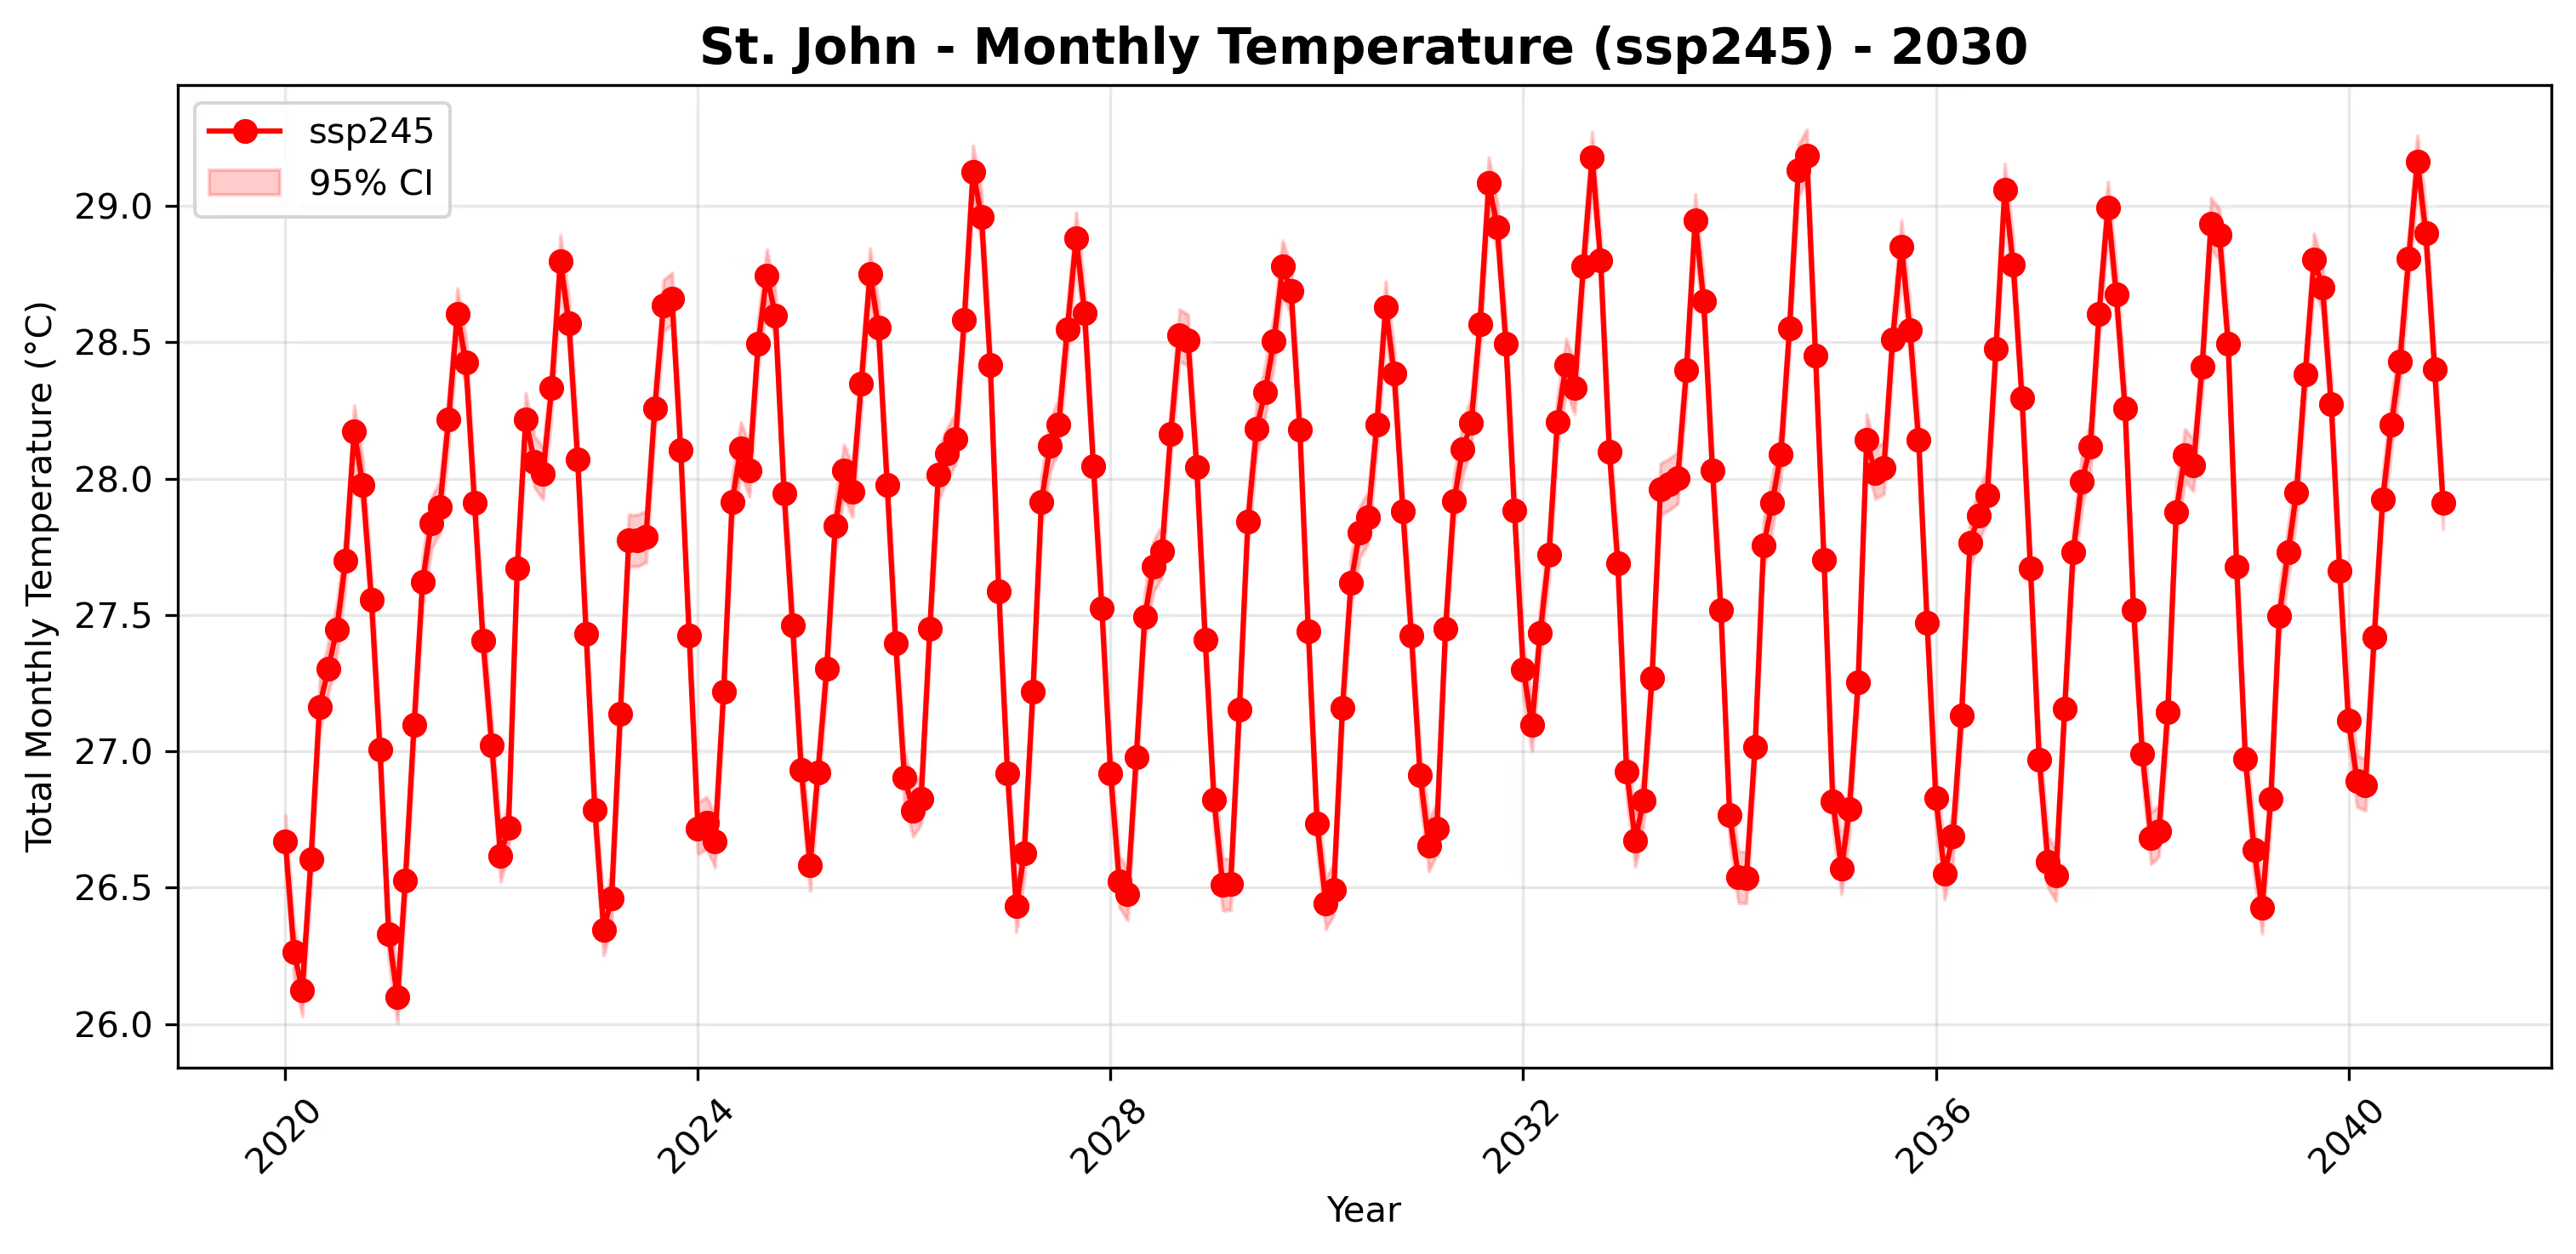
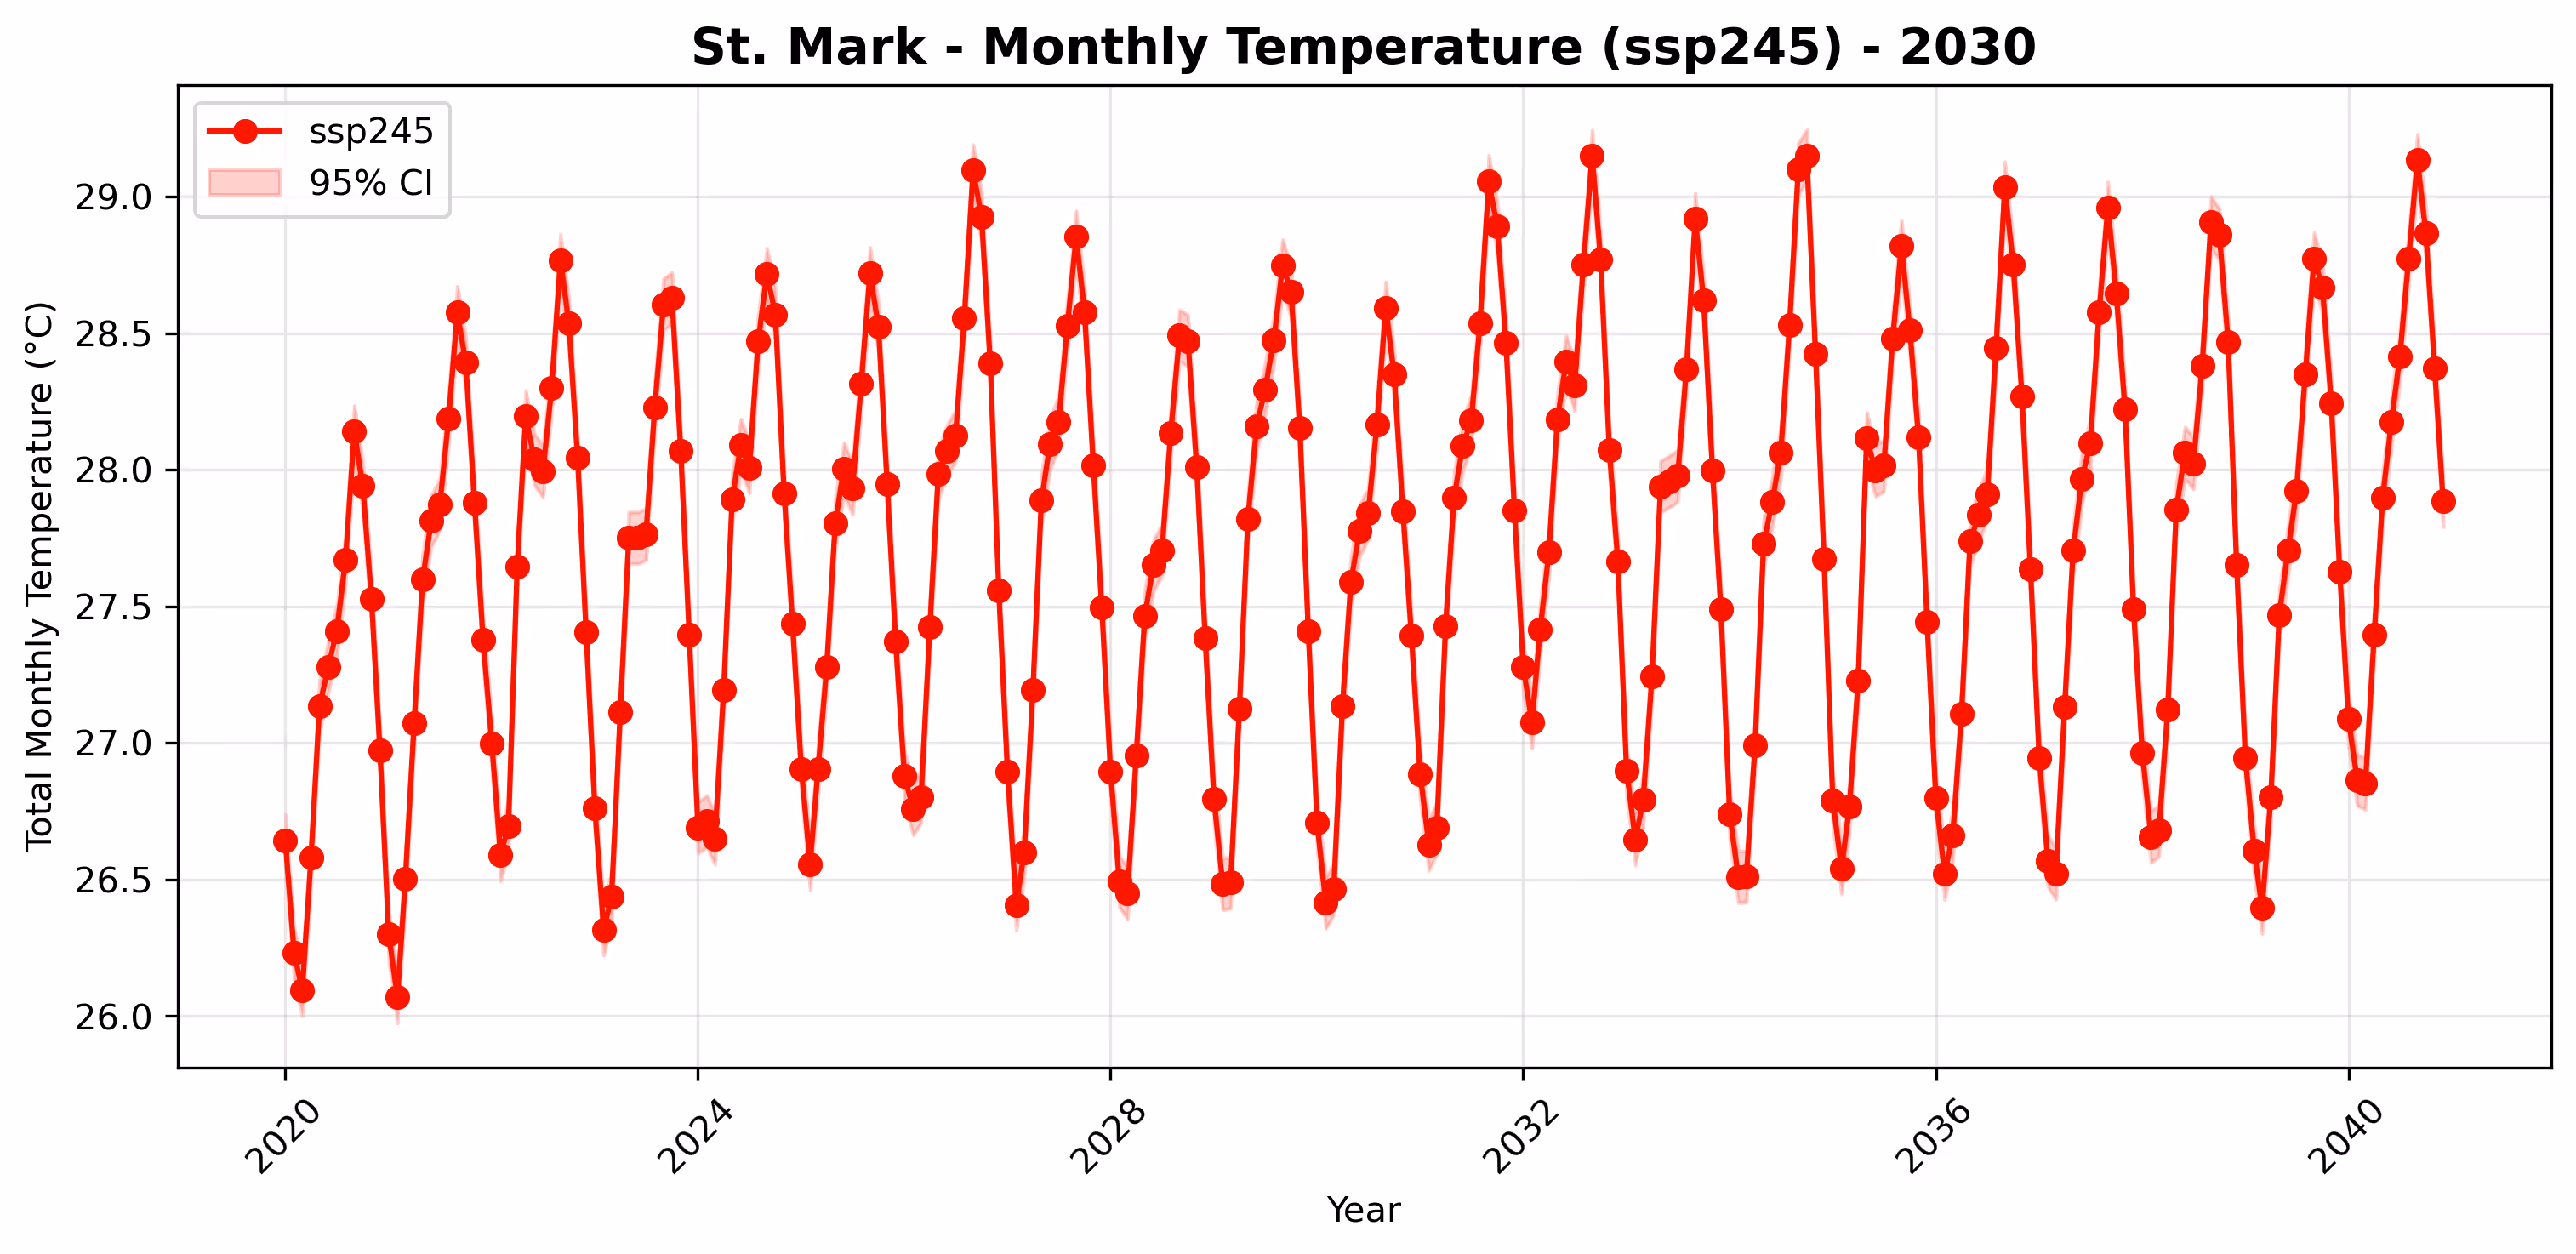
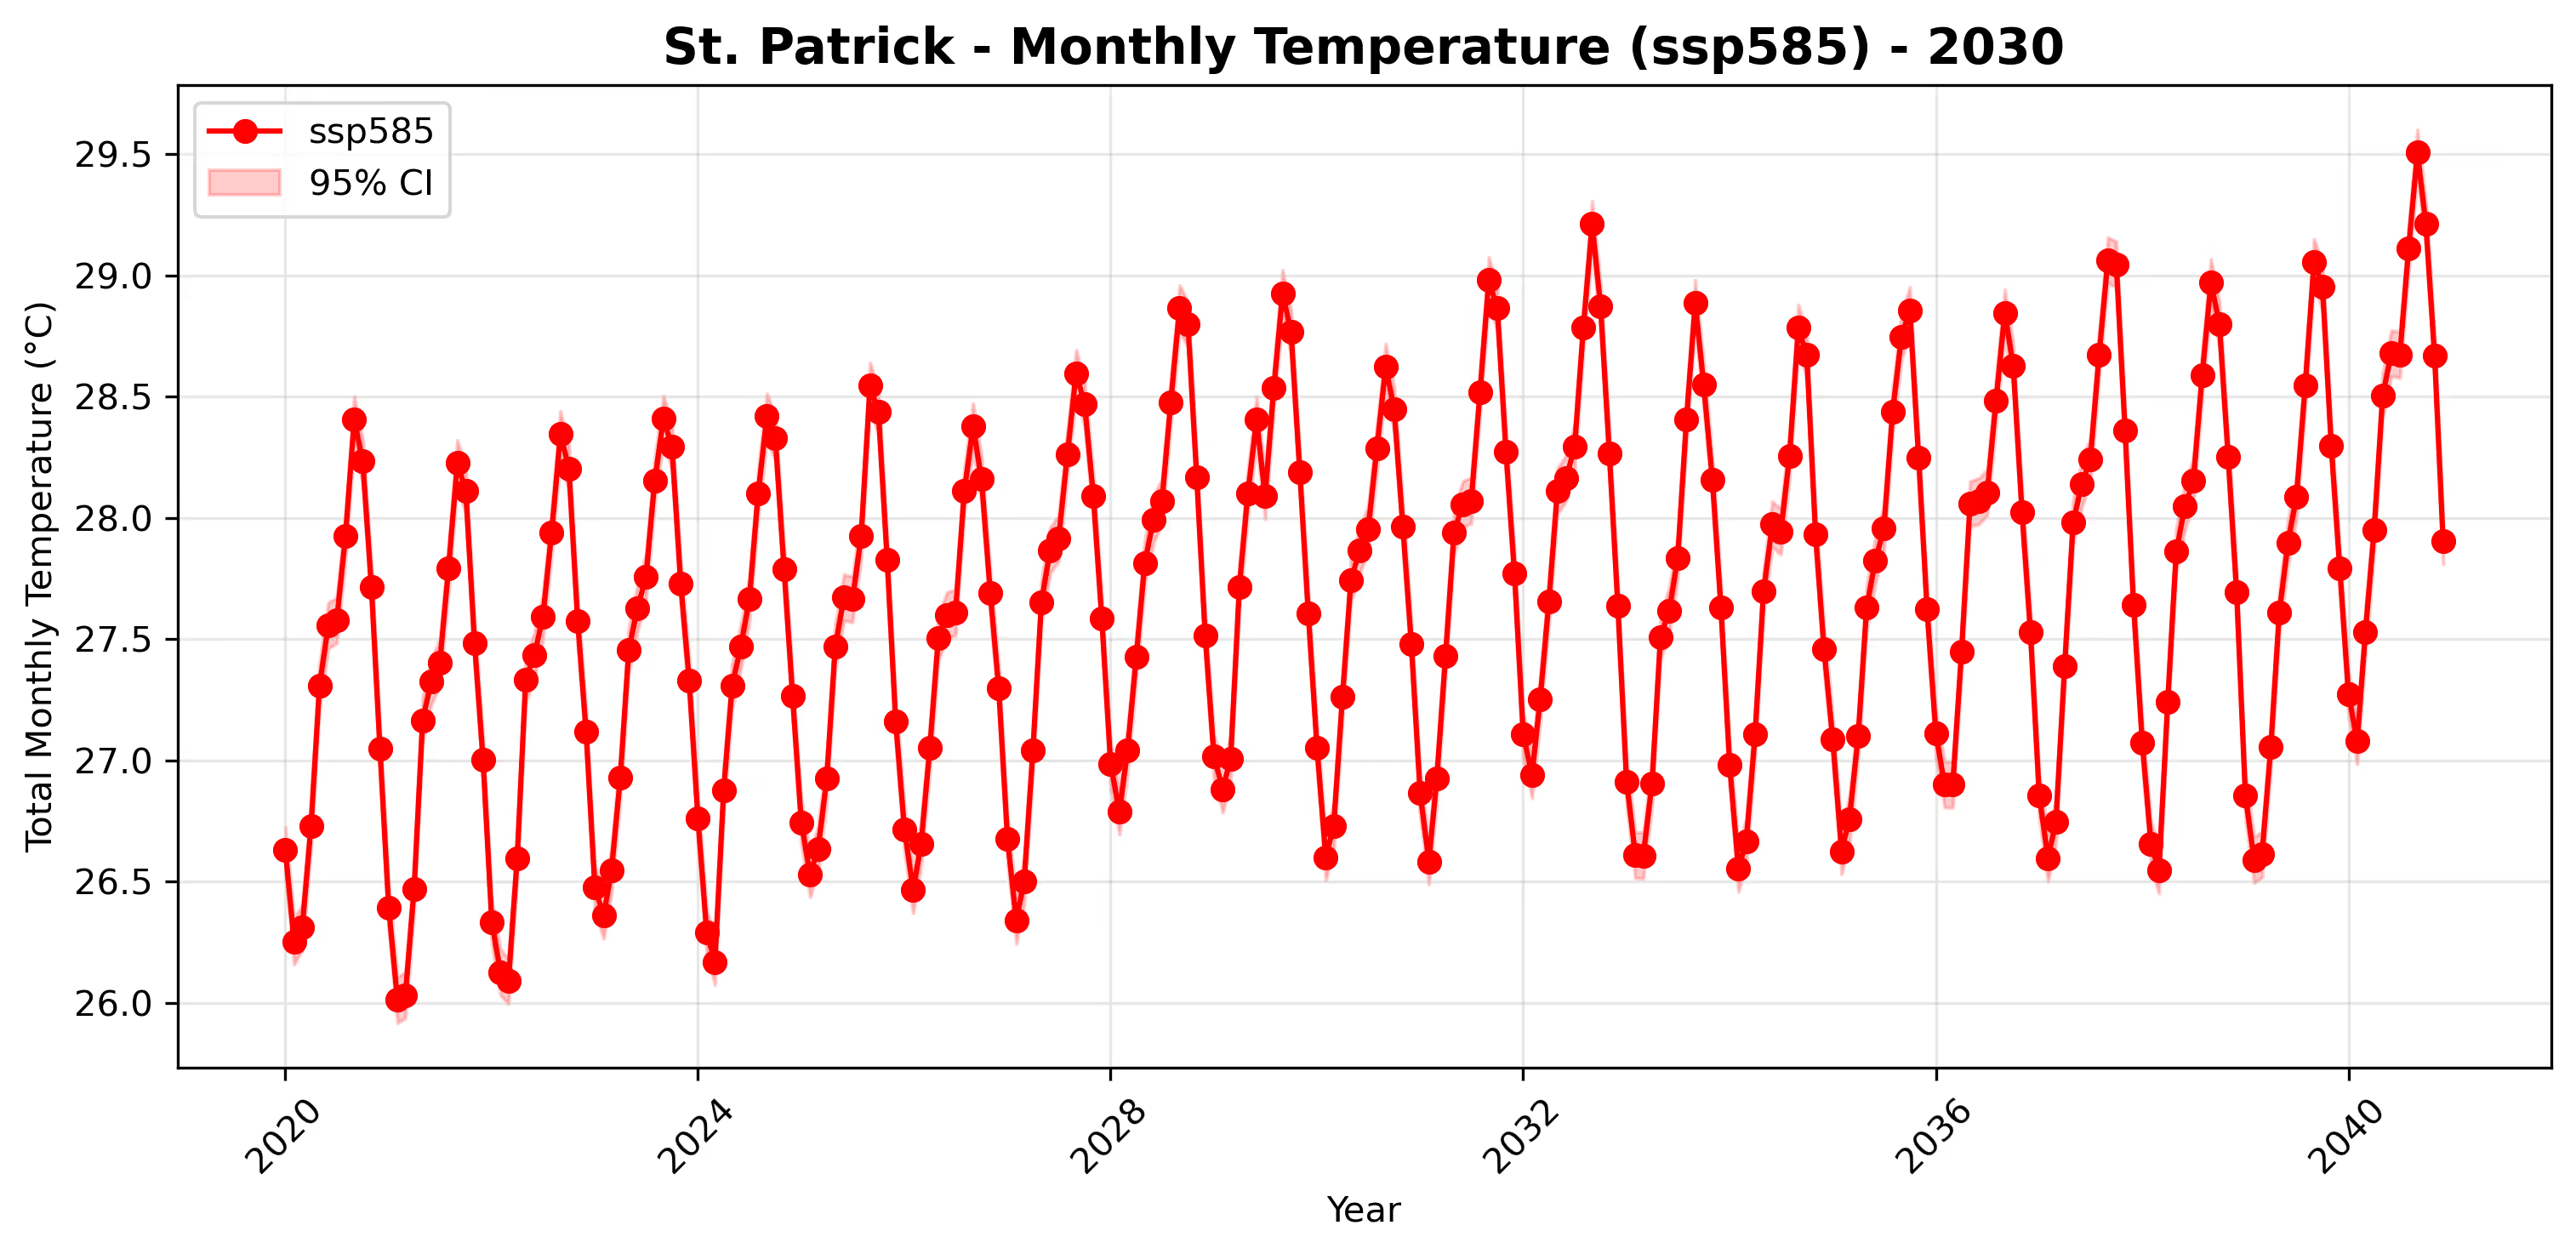
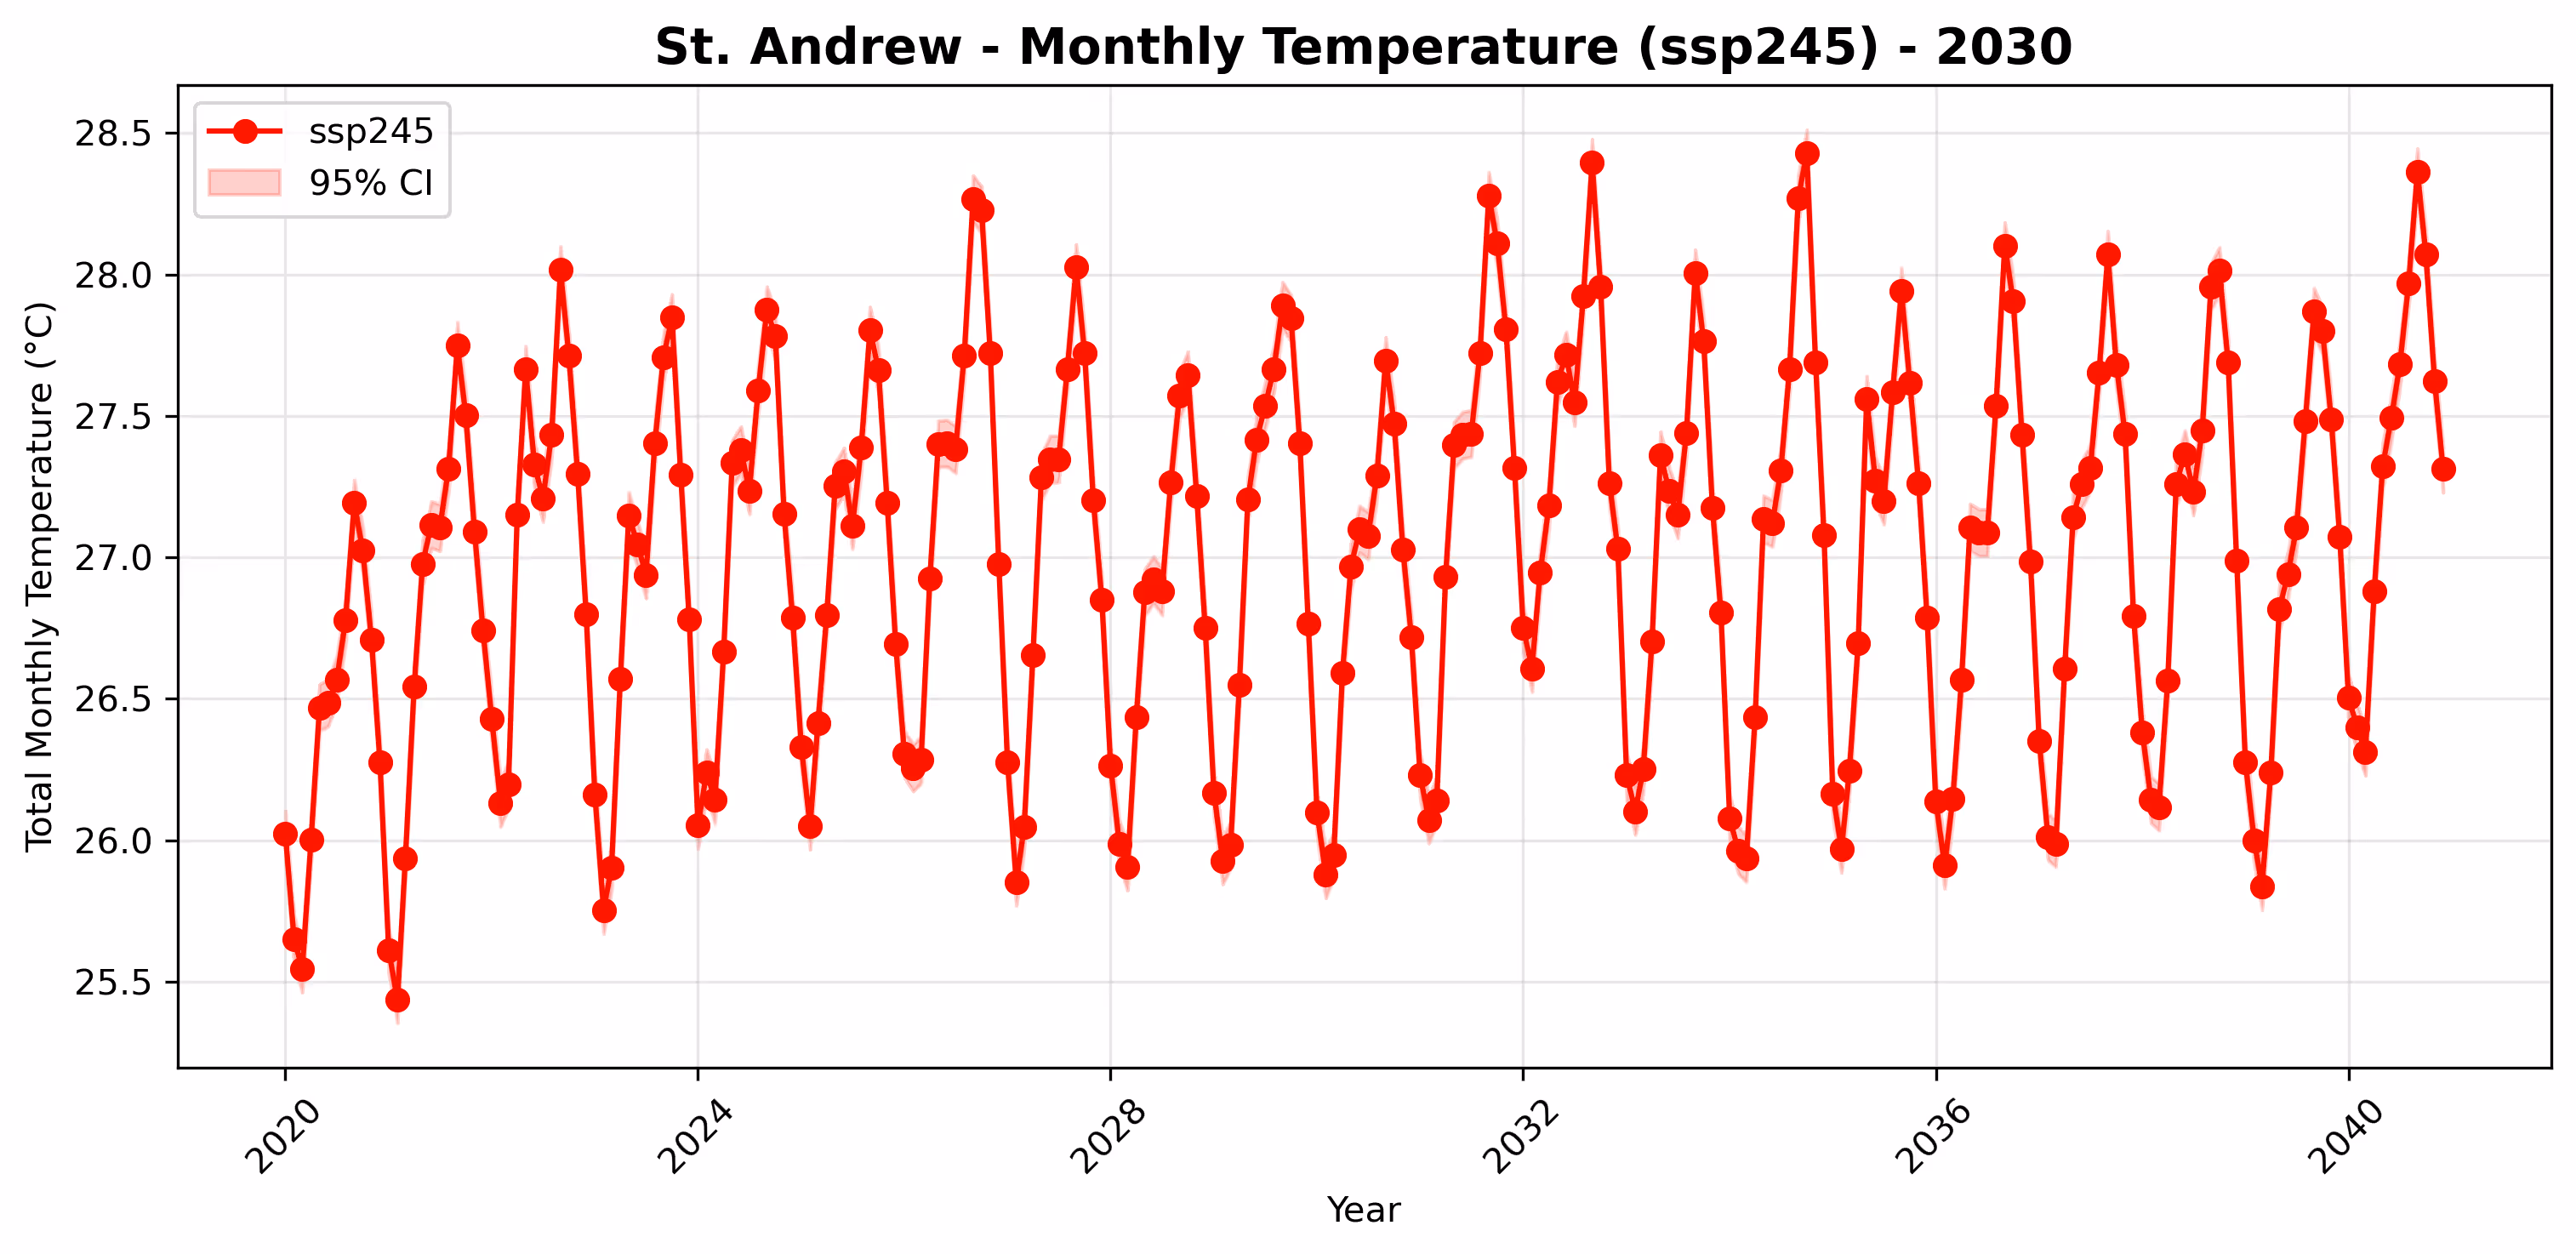
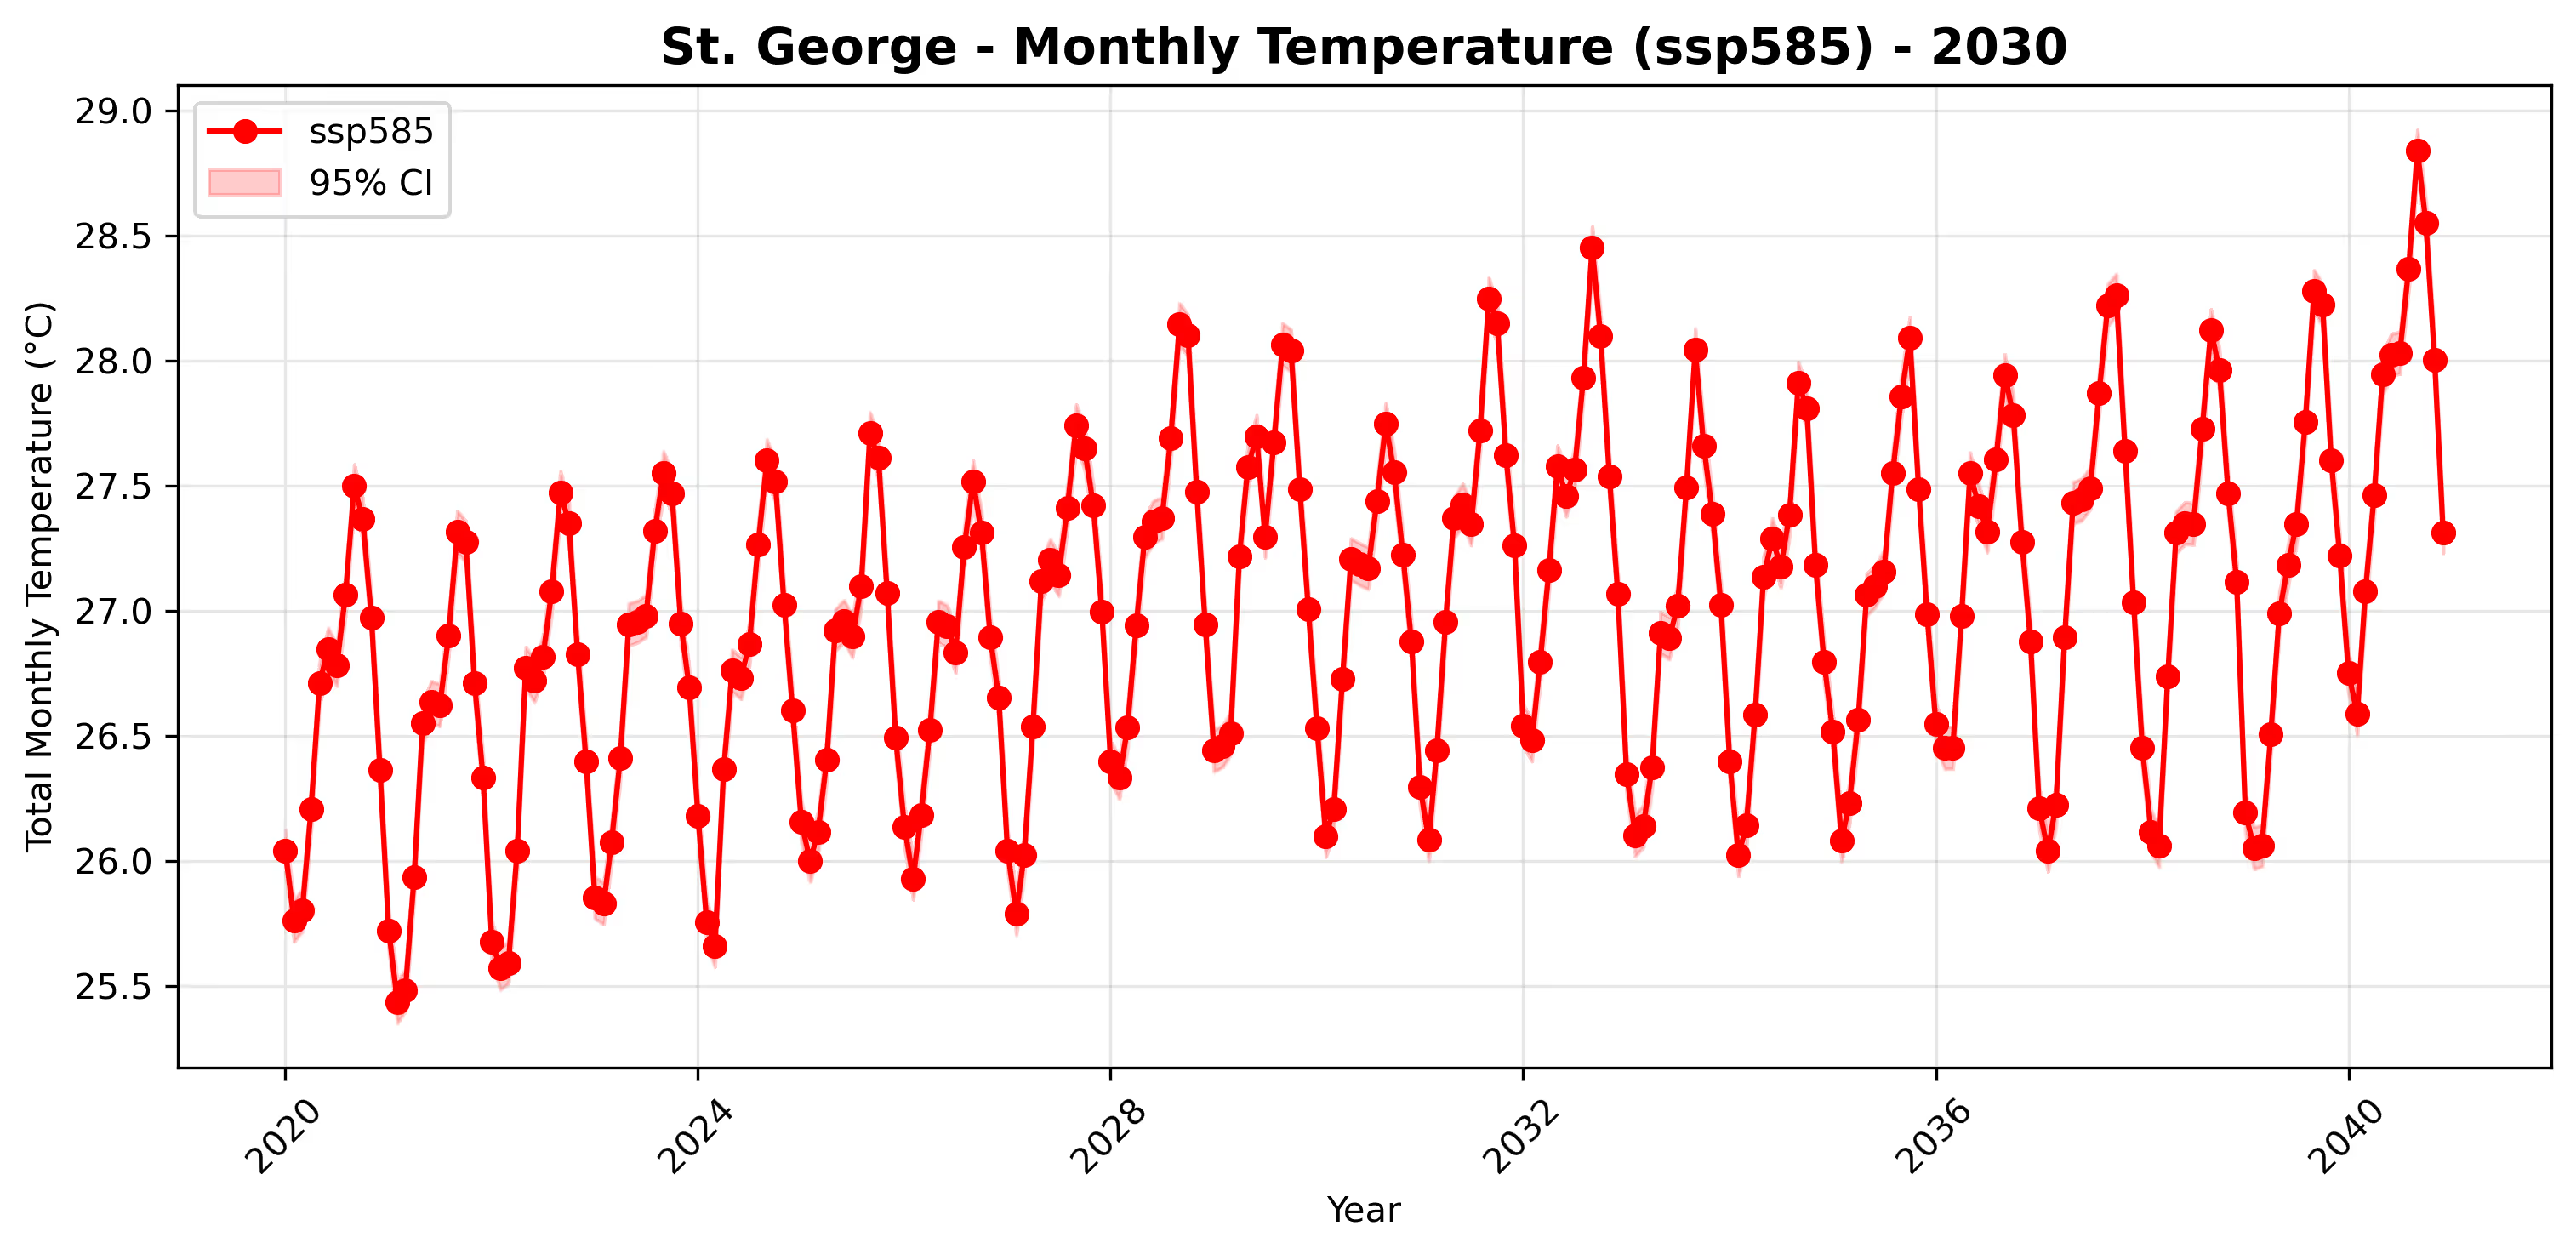
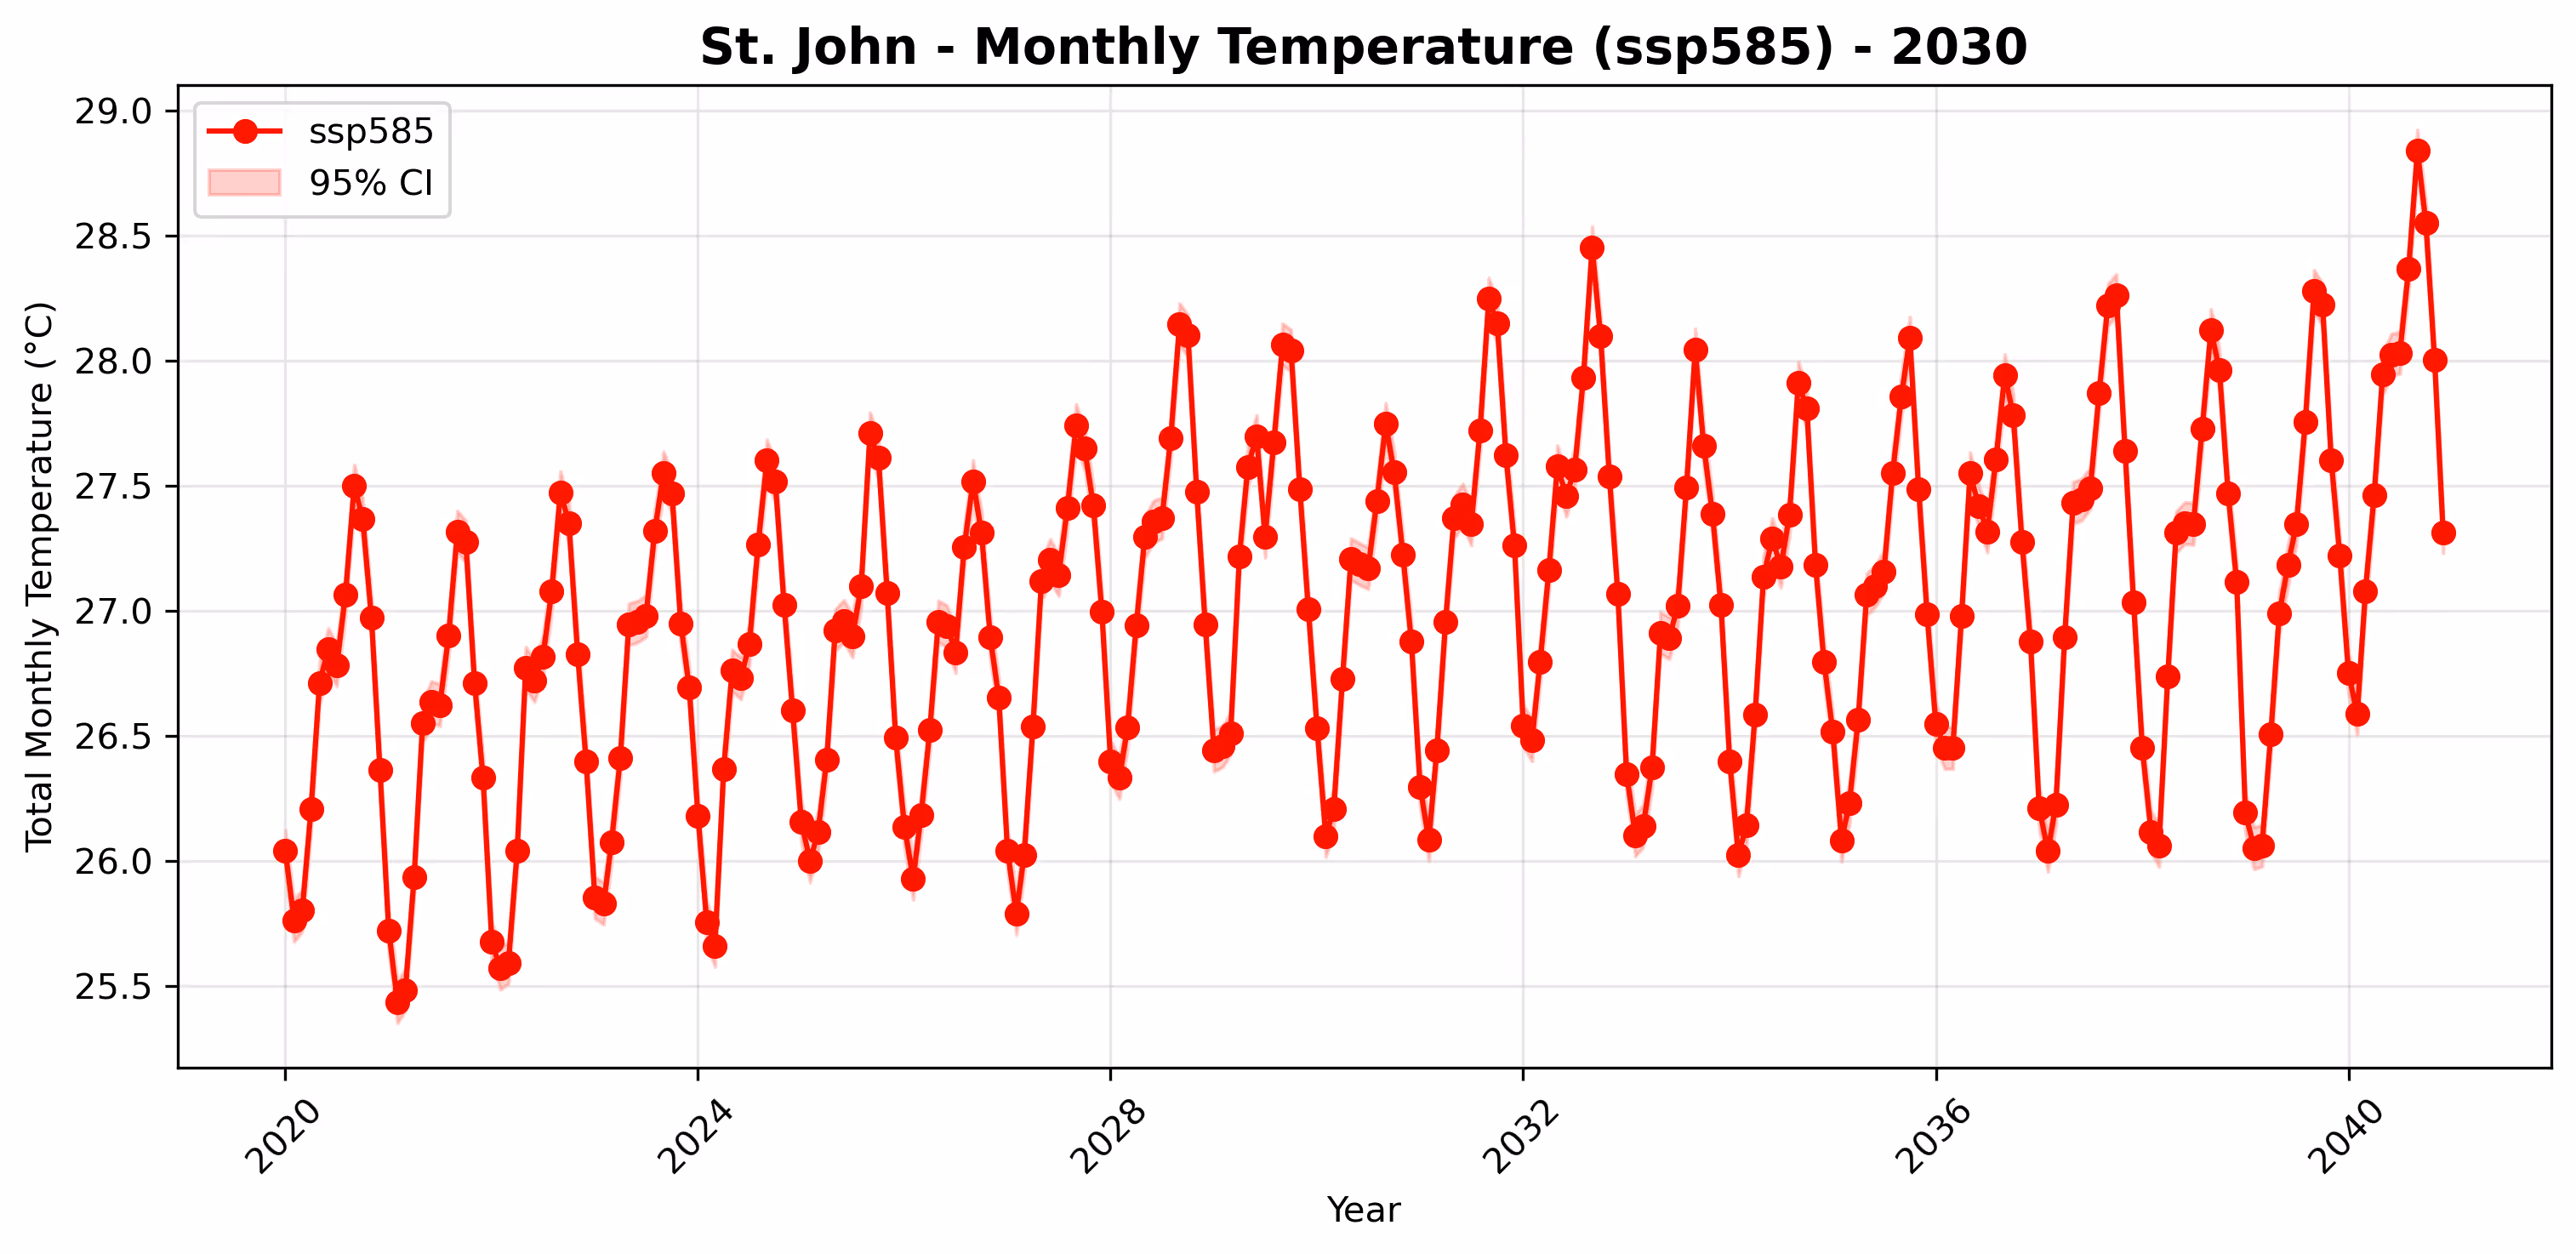
Temperature projections were assessed through minimum (tasmin), maximum (tasmax), and mean temperature (tas_mean) to evaluate the extent of future warming. Changes in minimum and maximum temperatures provide insight into potential increases in heat extremes and reductions in cold events, which have implications for heat stress, growing season length, and energy demand. The mean temperature was computed as the average of tasmax and tasmin to assess overall warming trends. These projections, derived from the model ensemble mean, offer a comprehensive view of how temperature extremes and averages may shift under future climate scenarios.

Min. Temperature - 2030

Max. Temperature - 2030

Mean. Temperature - 2030

Minimum climatology Temperature - 2030

Download Data
+

St. Andrew - 2030

St. David - 2030

St. George - 2030

St. John - 2030

St. Mark - 2030

St. Patrick - 2030

Maximum climatology Temperature - 2030

Download Data
+

St. Andrew - 2030

St. David - 2030

St. George - 2030

St. John - 2030

St. Mark - 2030

St. Patrick - 2030

Mean climatology Temperature - 2030

Download Data
+

St. Andrew - 2030

St. David - 2030

St. George - 2030

St. John - 2030

St. Mark - 2030

St. Patrick - 2030

Minimum interannual Temperature - 2030

Download Data
+

St. Andrew - 2030

St. David - 2030

St. George - 2030

St. John - 2030

St. Mark - 2030

St. Patrick - 2030

Maximum interannual Temperature - 2030

Download Data
+

St. Andrew - 2030

St. David - 2030

St. George - 2030

St. John - 2030

St. Mark - 2030

St. Patrick - 2030

Mean interannual Temperature - 2030

Download Data
+

St. Andrew - 2030

St. David - 2030

St. George - 2030

St. John - 2030

St. Mark - 2030

St. Patrick - 2030

Minimum monthly
Temperature - 2030

Download Data
+

St. Andrew - 2030

St. David - 2030

St. George - 2030

St. John - 2030

St. Mark - 2030

St. Patrick - 2030

Maximum monthly
Temperature - 2030

Download Data
+

St. Andrew - 2030

St. David - 2030

St. George - 2030

St. John - 2030

St. Mark - 2030

St. Patrick - 2030

Mean monthly
Temperature - 2030

Download Data
+

St. Andrew - 2030

St. David - 2030

St. George - 2030

St. John - 2030

St. Mark - 2030

St. Patrick - 2030